Welsh vs Israeli Median Female Earnings
COMPARE
Welsh
Israeli
Median Female Earnings
Median Female Earnings Comparison
Welsh
Israelis
$37,856
MEDIAN FEMALE EARNINGS
2.1/ 100
METRIC RATING
251st/ 347
METRIC RANK
$43,852
MEDIAN FEMALE EARNINGS
100.0/ 100
METRIC RATING
39th/ 347
METRIC RANK
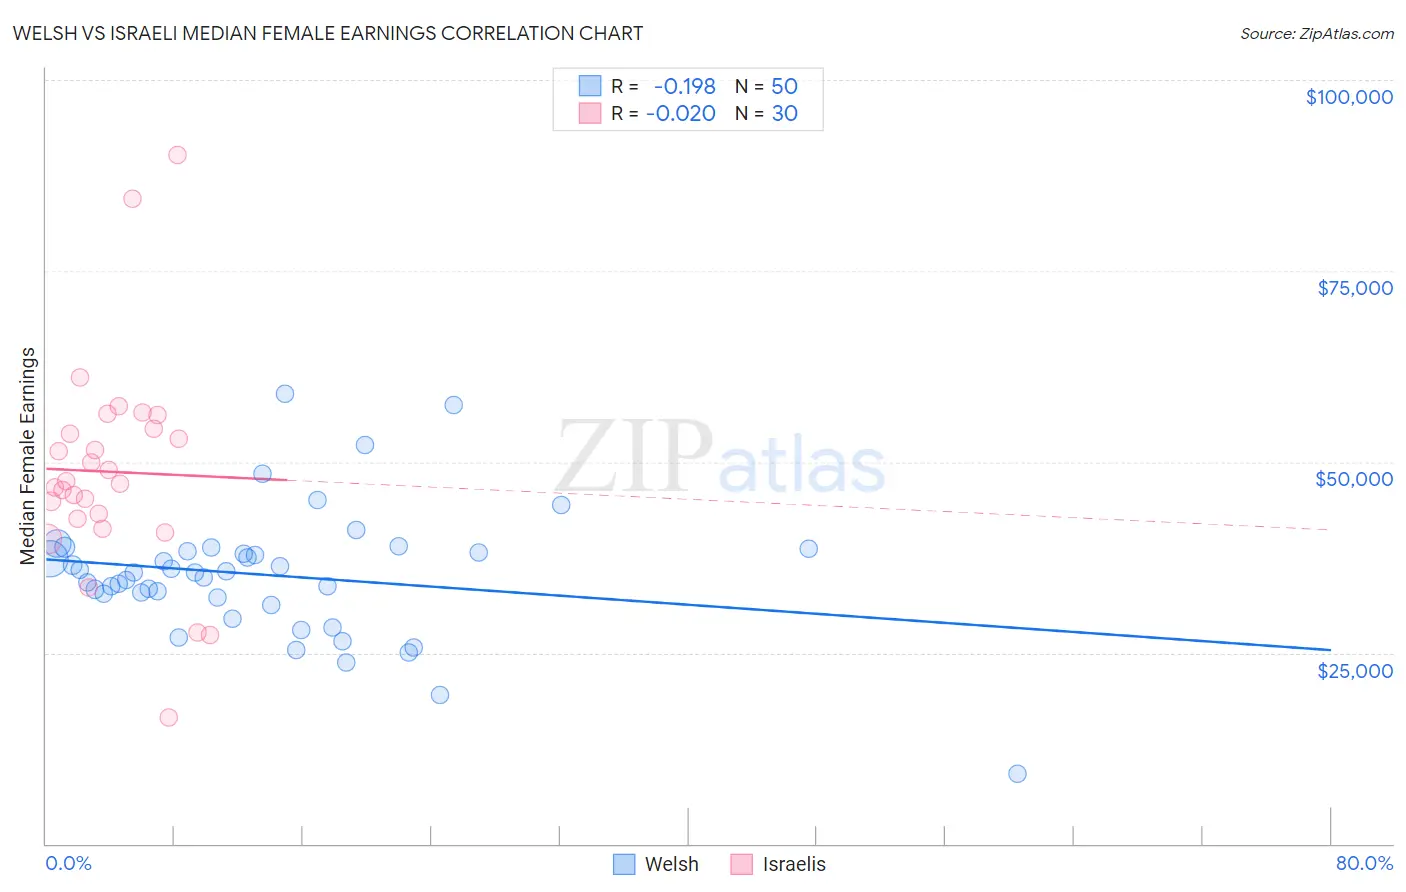
Welsh vs Israeli Median Female Earnings Correlation Chart
The statistical analysis conducted on geographies consisting of 527,602,521 people shows a poor negative correlation between the proportion of Welsh and median female earnings in the United States with a correlation coefficient (R) of -0.198 and weighted average of $37,856. Similarly, the statistical analysis conducted on geographies consisting of 211,198,030 people shows no correlation between the proportion of Israelis and median female earnings in the United States with a correlation coefficient (R) of -0.020 and weighted average of $43,852, a difference of 15.8%.
Median Female Earnings Correlation Summary
| Measurement | Welsh | Israeli |
| Minimum | $9,167 | $16,513 |
| Maximum | $58,927 | $90,109 |
| Range | $49,760 | $73,596 |
| Mean | $35,195 | $48,703 |
| Median | $35,531 | $47,323 |
| Interquartile 25% (IQ1) | $32,290 | $42,485 |
| Interquartile 75% (IQ3) | $38,296 | $54,278 |
| Interquartile Range (IQR) | $6,005 | $11,793 |
| Standard Deviation (Sample) | $8,494 | $14,338 |
| Standard Deviation (Population) | $8,409 | $14,097 |
Similar Demographics by Median Female Earnings
Demographics Similar to Welsh by Median Female Earnings
In terms of median female earnings, the demographic groups most similar to Welsh are Immigrants from Iraq ($37,864, a difference of 0.020%), Immigrants from Dominica ($37,825, a difference of 0.080%), Alaskan Athabascan ($37,905, a difference of 0.13%), Swiss ($37,904, a difference of 0.13%), and Immigrants from Somalia ($37,914, a difference of 0.15%).
| Demographics | Rating | Rank | Median Female Earnings |
| Immigrants | Liberia | 2.7 /100 | #244 | Tragic $37,970 |
| Immigrants | Middle Africa | 2.7 /100 | #245 | Tragic $37,965 |
| Delaware | 2.6 /100 | #246 | Tragic $37,964 |
| Immigrants | Somalia | 2.4 /100 | #247 | Tragic $37,914 |
| Alaskan Athabascans | 2.3 /100 | #248 | Tragic $37,905 |
| Swiss | 2.3 /100 | #249 | Tragic $37,904 |
| Immigrants | Iraq | 2.2 /100 | #250 | Tragic $37,864 |
| Welsh | 2.1 /100 | #251 | Tragic $37,856 |
| Immigrants | Dominica | 2.0 /100 | #252 | Tragic $37,825 |
| Danes | 1.6 /100 | #253 | Tragic $37,730 |
| Whites/Caucasians | 1.1 /100 | #254 | Tragic $37,531 |
| Colville | 1.1 /100 | #255 | Tragic $37,514 |
| Samoans | 1.0 /100 | #256 | Tragic $37,498 |
| Hawaiians | 1.0 /100 | #257 | Tragic $37,497 |
| Belizeans | 0.9 /100 | #258 | Tragic $37,429 |
Demographics Similar to Israelis by Median Female Earnings
In terms of median female earnings, the demographic groups most similar to Israelis are Immigrants from Malaysia ($43,835, a difference of 0.040%), Latvian ($43,941, a difference of 0.20%), Immigrants from Switzerland ($43,996, a difference of 0.33%), Bhutanese ($43,648, a difference of 0.47%), and Immigrants from Denmark ($43,646, a difference of 0.47%).
| Demographics | Rating | Rank | Median Female Earnings |
| Immigrants | Northern Europe | 100.0 /100 | #32 | Exceptional $44,366 |
| Immigrants | Asia | 100.0 /100 | #33 | Exceptional $44,198 |
| Russians | 100.0 /100 | #34 | Exceptional $44,169 |
| Immigrants | Sri Lanka | 100.0 /100 | #35 | Exceptional $44,161 |
| Immigrants | Turkey | 100.0 /100 | #36 | Exceptional $44,066 |
| Immigrants | Switzerland | 100.0 /100 | #37 | Exceptional $43,996 |
| Latvians | 100.0 /100 | #38 | Exceptional $43,941 |
| Israelis | 100.0 /100 | #39 | Exceptional $43,852 |
| Immigrants | Malaysia | 100.0 /100 | #40 | Exceptional $43,835 |
| Bhutanese | 100.0 /100 | #41 | Exceptional $43,648 |
| Immigrants | Denmark | 100.0 /100 | #42 | Exceptional $43,646 |
| Bulgarians | 100.0 /100 | #43 | Exceptional $43,638 |
| Immigrants | Czechoslovakia | 100.0 /100 | #44 | Exceptional $43,571 |
| Immigrants | Europe | 100.0 /100 | #45 | Exceptional $43,523 |
| Immigrants | Bolivia | 100.0 /100 | #46 | Exceptional $43,467 |