Immigrants from Guatemala vs Native Hawaiian Median Household Income
COMPARE
Immigrants from Guatemala
Native Hawaiian
Median Household Income
Median Household Income Comparison
Immigrants from Guatemala
Native Hawaiians
$75,123
MEDIAN HOUSEHOLD INCOME
0.2/ 100
METRIC RATING
279th/ 347
METRIC RANK
$89,919
MEDIAN HOUSEHOLD INCOME
95.7/ 100
METRIC RATING
116th/ 347
METRIC RANK
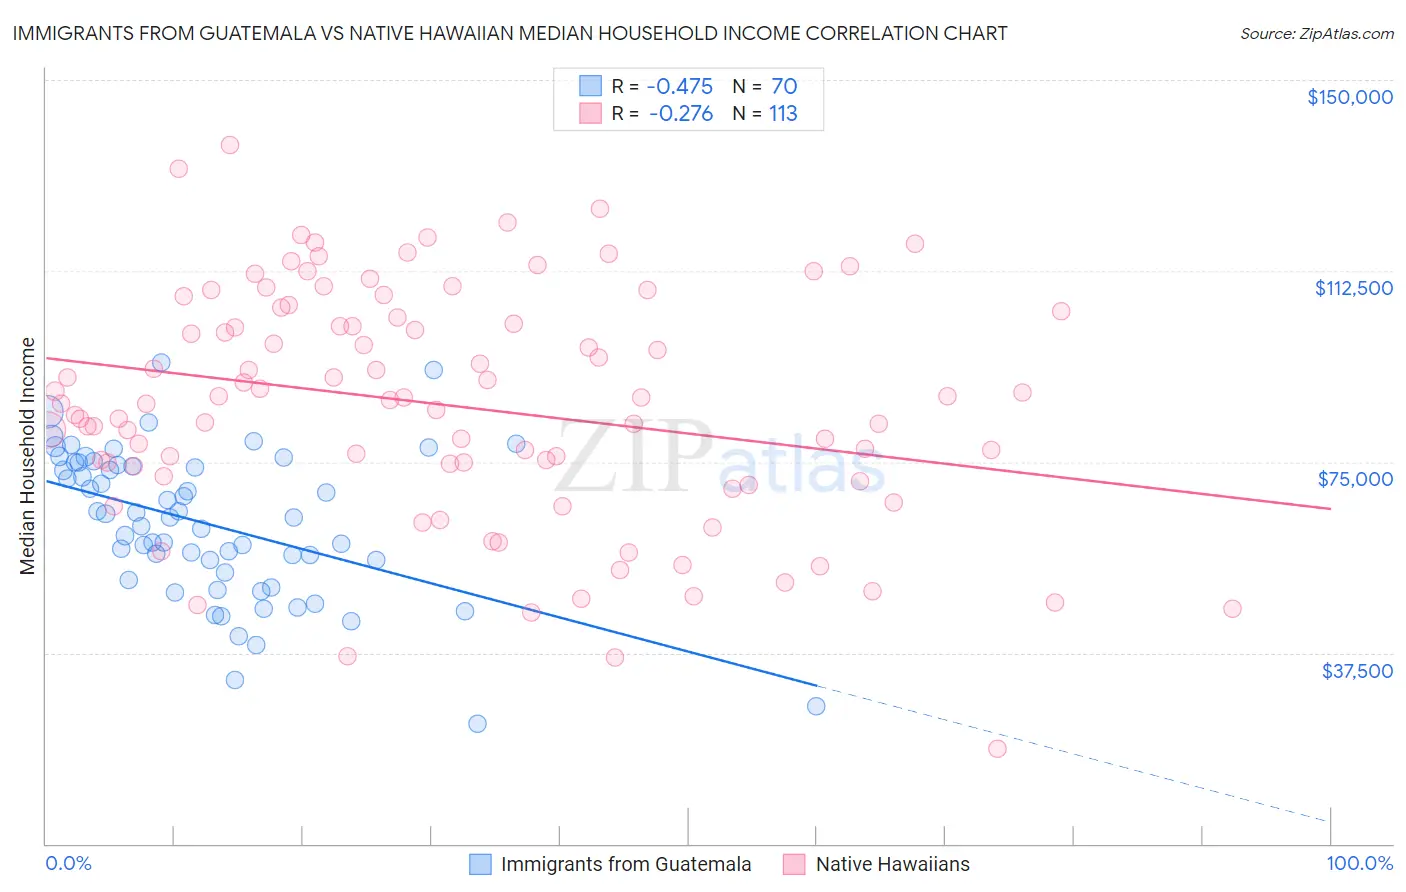
Immigrants from Guatemala vs Native Hawaiian Median Household Income Correlation Chart
The statistical analysis conducted on geographies consisting of 377,100,109 people shows a moderate negative correlation between the proportion of Immigrants from Guatemala and median household income in the United States with a correlation coefficient (R) of -0.475 and weighted average of $75,123. Similarly, the statistical analysis conducted on geographies consisting of 331,802,706 people shows a weak negative correlation between the proportion of Native Hawaiians and median household income in the United States with a correlation coefficient (R) of -0.276 and weighted average of $89,919, a difference of 19.7%.
Median Household Income Correlation Summary
| Measurement | Immigrants from Guatemala | Native Hawaiian |
| Minimum | $23,564 | $18,739 |
| Maximum | $94,609 | $137,302 |
| Range | $71,045 | $118,563 |
| Mean | $62,757 | $86,036 |
| Median | $64,030 | $87,089 |
| Interquartile 25% (IQ1) | $53,313 | $73,233 |
| Interquartile 75% (IQ3) | $74,300 | $104,035 |
| Interquartile Range (IQR) | $20,987 | $30,802 |
| Standard Deviation (Sample) | $14,592 | $23,037 |
| Standard Deviation (Population) | $14,488 | $22,935 |
Similar Demographics by Median Household Income
Demographics Similar to Immigrants from Guatemala by Median Household Income
In terms of median household income, the demographic groups most similar to Immigrants from Guatemala are Osage ($75,240, a difference of 0.16%), Senegalese ($74,999, a difference of 0.16%), Immigrants from Liberia ($74,896, a difference of 0.30%), Spanish American ($75,386, a difference of 0.35%), and Central American Indian ($74,847, a difference of 0.37%).
| Demographics | Rating | Rank | Median Household Income |
| Somalis | 0.3 /100 | #272 | Tragic $75,782 |
| Liberians | 0.2 /100 | #273 | Tragic $75,667 |
| British West Indians | 0.2 /100 | #274 | Tragic $75,647 |
| Immigrants | Micronesia | 0.2 /100 | #275 | Tragic $75,574 |
| Immigrants | Latin America | 0.2 /100 | #276 | Tragic $75,420 |
| Spanish Americans | 0.2 /100 | #277 | Tragic $75,386 |
| Osage | 0.2 /100 | #278 | Tragic $75,240 |
| Immigrants | Guatemala | 0.2 /100 | #279 | Tragic $75,123 |
| Senegalese | 0.2 /100 | #280 | Tragic $74,999 |
| Immigrants | Liberia | 0.1 /100 | #281 | Tragic $74,896 |
| Central American Indians | 0.1 /100 | #282 | Tragic $74,847 |
| Cree | 0.1 /100 | #283 | Tragic $74,685 |
| Yaqui | 0.1 /100 | #284 | Tragic $74,596 |
| Mexicans | 0.1 /100 | #285 | Tragic $74,399 |
| Immigrants | Somalia | 0.1 /100 | #286 | Tragic $74,300 |
Demographics Similar to Native Hawaiians by Median Household Income
In terms of median household income, the demographic groups most similar to Native Hawaiians are Taiwanese ($89,900, a difference of 0.020%), Immigrants from Western Asia ($90,005, a difference of 0.10%), Syrian ($89,830, a difference of 0.10%), Immigrants from Northern Africa ($90,026, a difference of 0.12%), and Albanian ($89,744, a difference of 0.20%).
| Demographics | Rating | Rank | Median Household Income |
| Chileans | 97.2 /100 | #109 | Exceptional $90,605 |
| Palestinians | 97.1 /100 | #110 | Exceptional $90,574 |
| Immigrants | Poland | 97.1 /100 | #111 | Exceptional $90,549 |
| Northern Europeans | 96.9 /100 | #112 | Exceptional $90,446 |
| Peruvians | 96.5 /100 | #113 | Exceptional $90,261 |
| Immigrants | Northern Africa | 95.9 /100 | #114 | Exceptional $90,026 |
| Immigrants | Western Asia | 95.9 /100 | #115 | Exceptional $90,005 |
| Native Hawaiians | 95.7 /100 | #116 | Exceptional $89,919 |
| Taiwanese | 95.6 /100 | #117 | Exceptional $89,900 |
| Syrians | 95.4 /100 | #118 | Exceptional $89,830 |
| Albanians | 95.2 /100 | #119 | Exceptional $89,744 |
| Immigrants | North Macedonia | 95.2 /100 | #120 | Exceptional $89,741 |
| Ethiopians | 94.9 /100 | #121 | Exceptional $89,640 |
| Pakistanis | 94.8 /100 | #122 | Exceptional $89,638 |
| Immigrants | Zimbabwe | 94.4 /100 | #123 | Exceptional $89,496 |