Ukrainian vs Cypriot Median Male Earnings
COMPARE
Ukrainian
Cypriot
Median Male Earnings
Median Male Earnings Comparison
Ukrainians
Cypriots
$59,728
MEDIAN MALE EARNINGS
99.4/ 100
METRIC RATING
81st/ 347
METRIC RANK
$65,549
MEDIAN MALE EARNINGS
100.0/ 100
METRIC RATING
19th/ 347
METRIC RANK
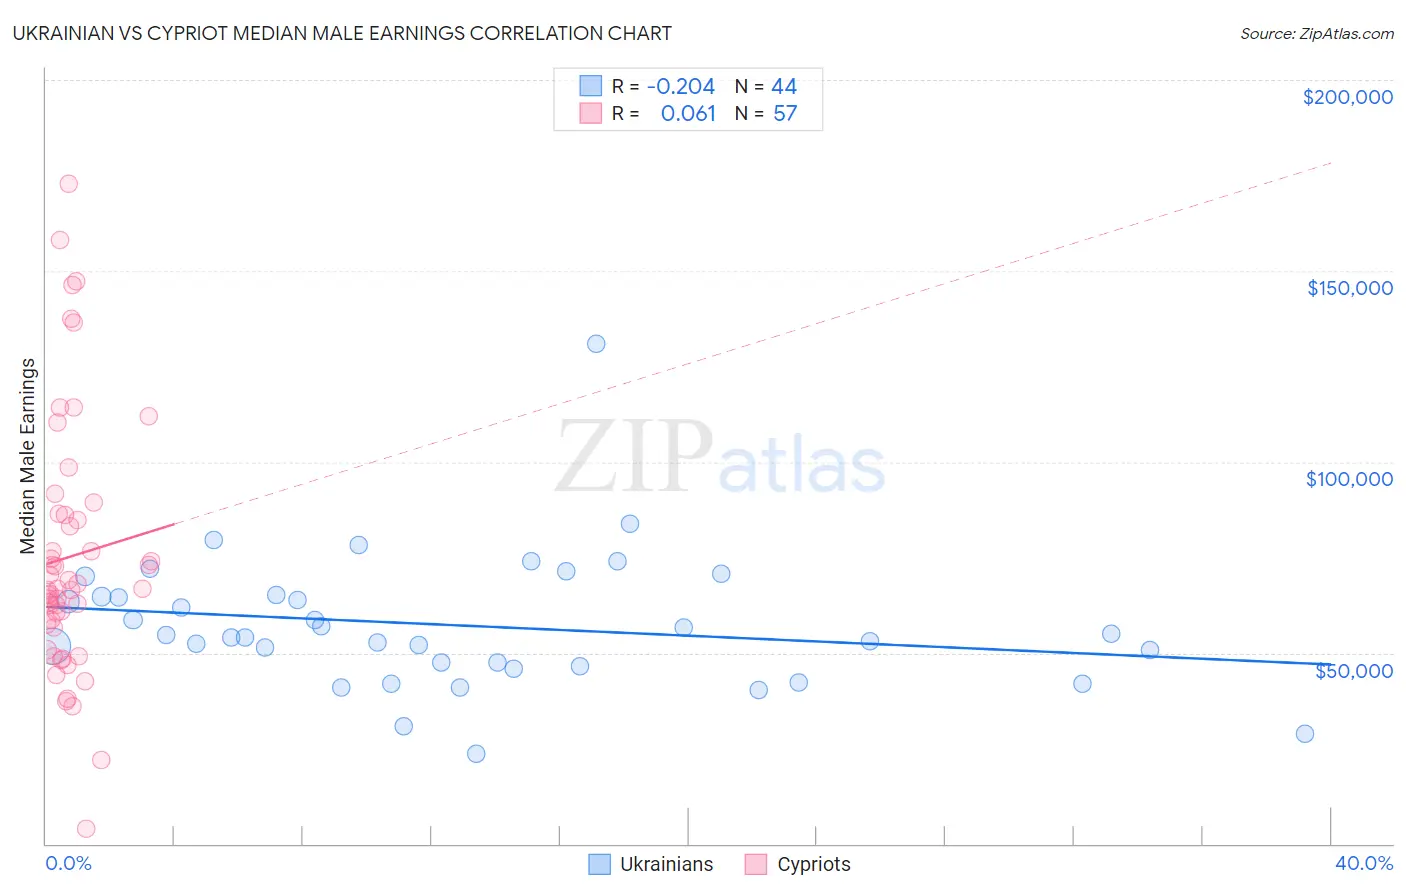
Ukrainian vs Cypriot Median Male Earnings Correlation Chart
The statistical analysis conducted on geographies consisting of 448,432,137 people shows a weak negative correlation between the proportion of Ukrainians and median male earnings in the United States with a correlation coefficient (R) of -0.204 and weighted average of $59,728. Similarly, the statistical analysis conducted on geographies consisting of 61,867,128 people shows a slight positive correlation between the proportion of Cypriots and median male earnings in the United States with a correlation coefficient (R) of 0.061 and weighted average of $65,549, a difference of 9.8%.
Median Male Earnings Correlation Summary
| Measurement | Ukrainian | Cypriot |
| Minimum | $23,696 | $3,864 |
| Maximum | $131,091 | $172,778 |
| Range | $107,394 | $168,914 |
| Mean | $57,214 | $75,157 |
| Median | $54,259 | $66,784 |
| Interquartile 25% (IQ1) | $46,850 | $56,985 |
| Interquartile 75% (IQ3) | $64,861 | $86,286 |
| Interquartile Range (IQR) | $18,011 | $29,301 |
| Standard Deviation (Sample) | $17,751 | $33,466 |
| Standard Deviation (Population) | $17,548 | $33,171 |
Similar Demographics by Median Male Earnings
Demographics Similar to Ukrainians by Median Male Earnings
In terms of median male earnings, the demographic groups most similar to Ukrainians are Croatian ($59,715, a difference of 0.020%), Immigrants from Italy ($59,691, a difference of 0.060%), Immigrants from Hungary ($59,806, a difference of 0.13%), Immigrants from Ukraine ($59,820, a difference of 0.16%), and Afghan ($59,554, a difference of 0.29%).
| Demographics | Rating | Rank | Median Male Earnings |
| Argentineans | 99.6 /100 | #74 | Exceptional $60,117 |
| Immigrants | Bolivia | 99.6 /100 | #75 | Exceptional $60,088 |
| Romanians | 99.6 /100 | #76 | Exceptional $60,063 |
| Paraguayans | 99.5 /100 | #77 | Exceptional $59,975 |
| Immigrants | Egypt | 99.5 /100 | #78 | Exceptional $59,925 |
| Immigrants | Ukraine | 99.5 /100 | #79 | Exceptional $59,820 |
| Immigrants | Hungary | 99.5 /100 | #80 | Exceptional $59,806 |
| Ukrainians | 99.4 /100 | #81 | Exceptional $59,728 |
| Croatians | 99.4 /100 | #82 | Exceptional $59,715 |
| Immigrants | Italy | 99.4 /100 | #83 | Exceptional $59,691 |
| Afghans | 99.3 /100 | #84 | Exceptional $59,554 |
| Italians | 99.3 /100 | #85 | Exceptional $59,551 |
| Immigrants | England | 99.3 /100 | #86 | Exceptional $59,527 |
| Macedonians | 99.3 /100 | #87 | Exceptional $59,522 |
| Immigrants | Argentina | 99.3 /100 | #88 | Exceptional $59,491 |
Demographics Similar to Cypriots by Median Male Earnings
In terms of median male earnings, the demographic groups most similar to Cypriots are Immigrants from Japan ($65,518, a difference of 0.050%), Immigrants from Sweden ($65,406, a difference of 0.22%), Burmese ($65,236, a difference of 0.48%), Immigrants from Korea ($65,079, a difference of 0.72%), and Indian (Asian) ($66,078, a difference of 0.81%).
| Demographics | Rating | Rank | Median Male Earnings |
| Immigrants | Australia | 100.0 /100 | #12 | Exceptional $67,634 |
| Immigrants | China | 100.0 /100 | #13 | Exceptional $67,353 |
| Okinawans | 100.0 /100 | #14 | Exceptional $67,232 |
| Immigrants | Eastern Asia | 100.0 /100 | #15 | Exceptional $66,903 |
| Eastern Europeans | 100.0 /100 | #16 | Exceptional $66,472 |
| Immigrants | Belgium | 100.0 /100 | #17 | Exceptional $66,125 |
| Indians (Asian) | 100.0 /100 | #18 | Exceptional $66,078 |
| Cypriots | 100.0 /100 | #19 | Exceptional $65,549 |
| Immigrants | Japan | 100.0 /100 | #20 | Exceptional $65,518 |
| Immigrants | Sweden | 100.0 /100 | #21 | Exceptional $65,406 |
| Burmese | 100.0 /100 | #22 | Exceptional $65,236 |
| Immigrants | Korea | 100.0 /100 | #23 | Exceptional $65,079 |
| Immigrants | Northern Europe | 100.0 /100 | #24 | Exceptional $64,987 |
| Immigrants | Denmark | 100.0 /100 | #25 | Exceptional $64,625 |
| Turks | 100.0 /100 | #26 | Exceptional $64,253 |