Creek vs Immigrants from Latvia Per Capita Income
COMPARE
Creek
Immigrants from Latvia
Per Capita Income
Per Capita Income Comparison
Creek
Immigrants from Latvia
$35,546
PER CAPITA INCOME
0.0/ 100
METRIC RATING
322nd/ 347
METRIC RANK
$50,914
PER CAPITA INCOME
100.0/ 100
METRIC RATING
46th/ 347
METRIC RANK
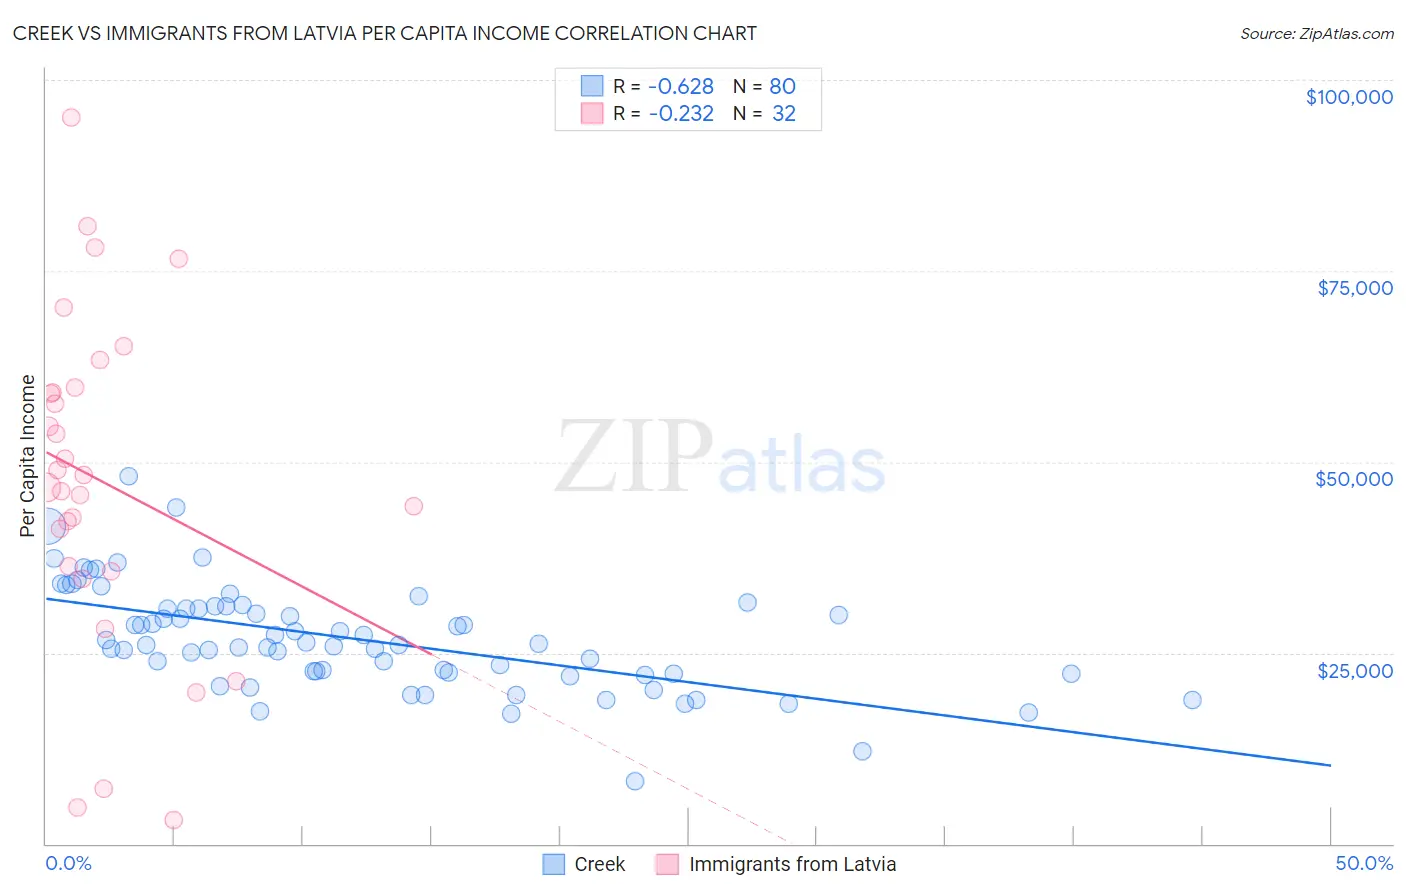
Creek vs Immigrants from Latvia Per Capita Income Correlation Chart
The statistical analysis conducted on geographies consisting of 178,484,884 people shows a significant negative correlation between the proportion of Creek and per capita income in the United States with a correlation coefficient (R) of -0.628 and weighted average of $35,546. Similarly, the statistical analysis conducted on geographies consisting of 113,739,608 people shows a weak negative correlation between the proportion of Immigrants from Latvia and per capita income in the United States with a correlation coefficient (R) of -0.232 and weighted average of $50,914, a difference of 43.2%.
Per Capita Income Correlation Summary
| Measurement | Creek | Immigrants from Latvia |
| Minimum | $8,185 | $3,055 |
| Maximum | $48,038 | $95,062 |
| Range | $39,853 | $92,007 |
| Mean | $26,882 | $47,518 |
| Median | $26,137 | $47,530 |
| Interquartile 25% (IQ1) | $22,339 | $35,985 |
| Interquartile 75% (IQ3) | $30,941 | $59,433 |
| Interquartile Range (IQR) | $8,603 | $23,448 |
| Standard Deviation (Sample) | $6,895 | $21,734 |
| Standard Deviation (Population) | $6,852 | $21,392 |
Similar Demographics by Per Capita Income
Demographics Similar to Creek by Per Capita Income
In terms of per capita income, the demographic groups most similar to Creek are Black/African American ($35,564, a difference of 0.050%), Hispanic or Latino ($35,688, a difference of 0.40%), Immigrants from Congo ($35,720, a difference of 0.49%), Cheyenne ($35,276, a difference of 0.76%), and Bangladeshi ($35,897, a difference of 0.99%).
| Demographics | Rating | Rank | Per Capita Income |
| Yaqui | 0.0 /100 | #315 | Tragic $36,112 |
| Choctaw | 0.0 /100 | #316 | Tragic $35,999 |
| Dutch West Indians | 0.0 /100 | #317 | Tragic $35,922 |
| Bangladeshis | 0.0 /100 | #318 | Tragic $35,897 |
| Immigrants | Congo | 0.0 /100 | #319 | Tragic $35,720 |
| Hispanics or Latinos | 0.0 /100 | #320 | Tragic $35,688 |
| Blacks/African Americans | 0.0 /100 | #321 | Tragic $35,564 |
| Creek | 0.0 /100 | #322 | Tragic $35,546 |
| Cheyenne | 0.0 /100 | #323 | Tragic $35,276 |
| Kiowa | 0.0 /100 | #324 | Tragic $35,102 |
| Immigrants | Central America | 0.0 /100 | #325 | Tragic $34,974 |
| Immigrants | Cuba | 0.0 /100 | #326 | Tragic $34,910 |
| Apache | 0.0 /100 | #327 | Tragic $34,886 |
| Menominee | 0.0 /100 | #328 | Tragic $34,578 |
| Mexicans | 0.0 /100 | #329 | Tragic $34,559 |
Demographics Similar to Immigrants from Latvia by Per Capita Income
In terms of per capita income, the demographic groups most similar to Immigrants from Latvia are Bulgarian ($50,906, a difference of 0.020%), Immigrants from Spain ($50,933, a difference of 0.040%), Immigrants from Europe ($50,950, a difference of 0.070%), Immigrants from Serbia ($50,810, a difference of 0.21%), and New Zealander ($50,575, a difference of 0.67%).
| Demographics | Rating | Rank | Per Capita Income |
| Cambodians | 100.0 /100 | #39 | Exceptional $51,731 |
| Immigrants | Korea | 100.0 /100 | #40 | Exceptional $51,671 |
| Immigrants | South Africa | 100.0 /100 | #41 | Exceptional $51,465 |
| Immigrants | Turkey | 100.0 /100 | #42 | Exceptional $51,368 |
| Immigrants | Lithuania | 100.0 /100 | #43 | Exceptional $51,361 |
| Immigrants | Europe | 100.0 /100 | #44 | Exceptional $50,950 |
| Immigrants | Spain | 100.0 /100 | #45 | Exceptional $50,933 |
| Immigrants | Latvia | 100.0 /100 | #46 | Exceptional $50,914 |
| Bulgarians | 100.0 /100 | #47 | Exceptional $50,906 |
| Immigrants | Serbia | 100.0 /100 | #48 | Exceptional $50,810 |
| New Zealanders | 100.0 /100 | #49 | Exceptional $50,575 |
| Immigrants | Sri Lanka | 100.0 /100 | #50 | Exceptional $50,555 |
| Immigrants | Netherlands | 100.0 /100 | #51 | Exceptional $50,458 |
| Immigrants | Croatia | 99.9 /100 | #52 | Exceptional $50,417 |
| Paraguayans | 99.9 /100 | #53 | Exceptional $50,385 |