Yup'ik vs Immigrants from Latvia Per Capita Income
COMPARE
Yup'ik
Immigrants from Latvia
Per Capita Income
Per Capita Income Comparison
Yup'ik
Immigrants from Latvia
$30,518
PER CAPITA INCOME
0.0/ 100
METRIC RATING
344th/ 347
METRIC RANK
$50,914
PER CAPITA INCOME
100.0/ 100
METRIC RATING
46th/ 347
METRIC RANK
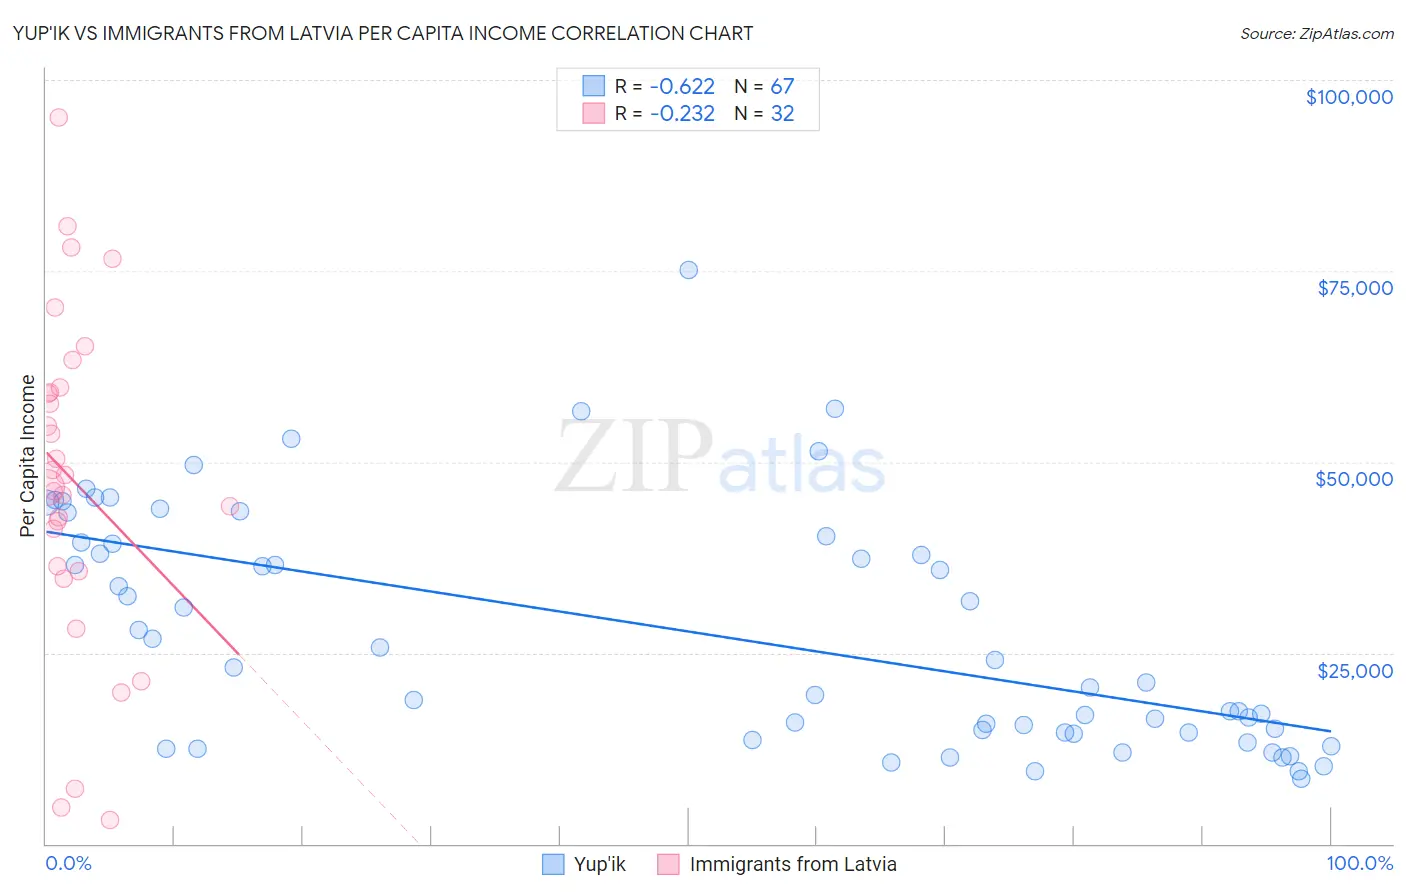
Yup'ik vs Immigrants from Latvia Per Capita Income Correlation Chart
The statistical analysis conducted on geographies consisting of 39,964,789 people shows a significant negative correlation between the proportion of Yup'ik and per capita income in the United States with a correlation coefficient (R) of -0.622 and weighted average of $30,518. Similarly, the statistical analysis conducted on geographies consisting of 113,739,608 people shows a weak negative correlation between the proportion of Immigrants from Latvia and per capita income in the United States with a correlation coefficient (R) of -0.232 and weighted average of $50,914, a difference of 66.8%.
Per Capita Income Correlation Summary
| Measurement | Yup'ik | Immigrants from Latvia |
| Minimum | $8,508 | $3,055 |
| Maximum | $75,144 | $95,062 |
| Range | $66,636 | $92,007 |
| Mean | $27,634 | $47,518 |
| Median | $23,141 | $47,530 |
| Interquartile 25% (IQ1) | $14,540 | $35,985 |
| Interquartile 75% (IQ3) | $39,384 | $59,433 |
| Interquartile Range (IQR) | $24,844 | $23,448 |
| Standard Deviation (Sample) | $15,386 | $21,734 |
| Standard Deviation (Population) | $15,271 | $21,392 |
Similar Demographics by Per Capita Income
Demographics Similar to Yup'ik by Per Capita Income
In terms of per capita income, the demographic groups most similar to Yup'ik are Pima ($30,644, a difference of 0.41%), Tohono O'odham ($30,256, a difference of 0.87%), Hopi ($31,177, a difference of 2.2%), Lumbee ($29,845, a difference of 2.3%), and Puerto Rican ($31,268, a difference of 2.5%).
| Demographics | Rating | Rank | Per Capita Income |
| Immigrants | Yemen | 0.0 /100 | #333 | Tragic $33,696 |
| Natives/Alaskans | 0.0 /100 | #334 | Tragic $33,279 |
| Yuman | 0.0 /100 | #335 | Tragic $33,236 |
| Yakama | 0.0 /100 | #336 | Tragic $33,009 |
| Houma | 0.0 /100 | #337 | Tragic $32,996 |
| Arapaho | 0.0 /100 | #338 | Tragic $32,345 |
| Pueblo | 0.0 /100 | #339 | Tragic $32,012 |
| Crow | 0.0 /100 | #340 | Tragic $31,729 |
| Puerto Ricans | 0.0 /100 | #341 | Tragic $31,268 |
| Hopi | 0.0 /100 | #342 | Tragic $31,177 |
| Pima | 0.0 /100 | #343 | Tragic $30,644 |
| Yup'ik | 0.0 /100 | #344 | Tragic $30,518 |
| Tohono O'odham | 0.0 /100 | #345 | Tragic $30,256 |
| Lumbee | 0.0 /100 | #346 | Tragic $29,845 |
| Navajo | 0.0 /100 | #347 | Tragic $29,031 |
Demographics Similar to Immigrants from Latvia by Per Capita Income
In terms of per capita income, the demographic groups most similar to Immigrants from Latvia are Bulgarian ($50,906, a difference of 0.020%), Immigrants from Spain ($50,933, a difference of 0.040%), Immigrants from Europe ($50,950, a difference of 0.070%), Immigrants from Serbia ($50,810, a difference of 0.21%), and New Zealander ($50,575, a difference of 0.67%).
| Demographics | Rating | Rank | Per Capita Income |
| Cambodians | 100.0 /100 | #39 | Exceptional $51,731 |
| Immigrants | Korea | 100.0 /100 | #40 | Exceptional $51,671 |
| Immigrants | South Africa | 100.0 /100 | #41 | Exceptional $51,465 |
| Immigrants | Turkey | 100.0 /100 | #42 | Exceptional $51,368 |
| Immigrants | Lithuania | 100.0 /100 | #43 | Exceptional $51,361 |
| Immigrants | Europe | 100.0 /100 | #44 | Exceptional $50,950 |
| Immigrants | Spain | 100.0 /100 | #45 | Exceptional $50,933 |
| Immigrants | Latvia | 100.0 /100 | #46 | Exceptional $50,914 |
| Bulgarians | 100.0 /100 | #47 | Exceptional $50,906 |
| Immigrants | Serbia | 100.0 /100 | #48 | Exceptional $50,810 |
| New Zealanders | 100.0 /100 | #49 | Exceptional $50,575 |
| Immigrants | Sri Lanka | 100.0 /100 | #50 | Exceptional $50,555 |
| Immigrants | Netherlands | 100.0 /100 | #51 | Exceptional $50,458 |
| Immigrants | Croatia | 99.9 /100 | #52 | Exceptional $50,417 |
| Paraguayans | 99.9 /100 | #53 | Exceptional $50,385 |