Turkish vs Immigrants from Eastern Africa Median Male Earnings
COMPARE
Turkish
Immigrants from Eastern Africa
Median Male Earnings
Median Male Earnings Comparison
Turks
Immigrants from Eastern Africa
$64,253
MEDIAN MALE EARNINGS
100.0/ 100
METRIC RATING
26th/ 347
METRIC RANK
$53,713
MEDIAN MALE EARNINGS
31.8/ 100
METRIC RATING
188th/ 347
METRIC RANK
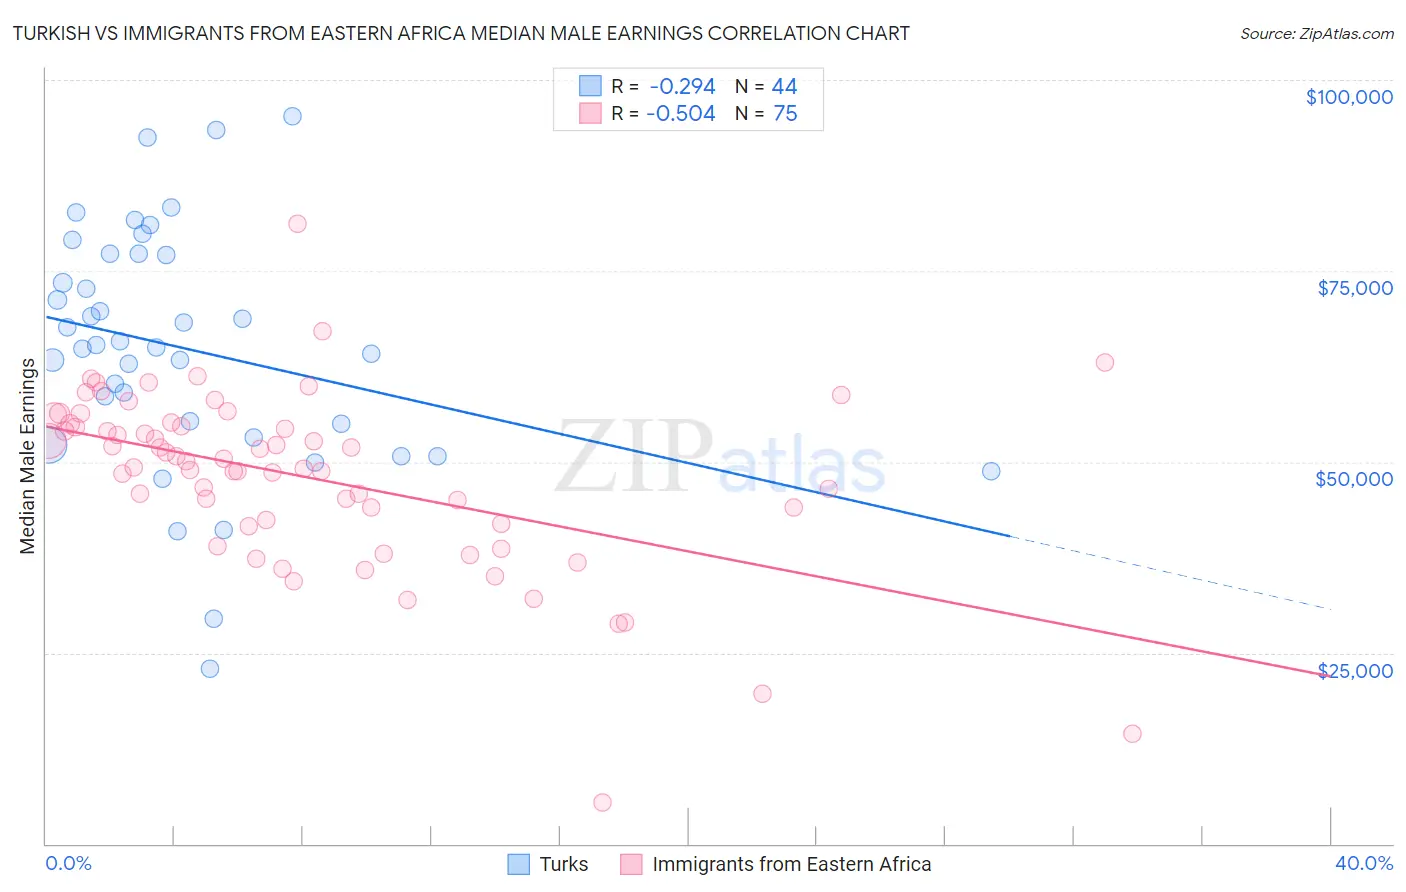
Turkish vs Immigrants from Eastern Africa Median Male Earnings Correlation Chart
The statistical analysis conducted on geographies consisting of 271,821,901 people shows a weak negative correlation between the proportion of Turks and median male earnings in the United States with a correlation coefficient (R) of -0.294 and weighted average of $64,253. Similarly, the statistical analysis conducted on geographies consisting of 355,094,627 people shows a substantial negative correlation between the proportion of Immigrants from Eastern Africa and median male earnings in the United States with a correlation coefficient (R) of -0.504 and weighted average of $53,713, a difference of 19.6%.
Median Male Earnings Correlation Summary
| Measurement | Turkish | Immigrants from Eastern Africa |
| Minimum | $22,917 | $5,481 |
| Maximum | $95,313 | $81,191 |
| Range | $72,396 | $75,710 |
| Mean | $64,813 | $47,968 |
| Median | $65,160 | $50,087 |
| Interquartile 25% (IQ1) | $54,093 | $41,922 |
| Interquartile 75% (IQ3) | $77,144 | $54,936 |
| Interquartile Range (IQR) | $23,051 | $13,014 |
| Standard Deviation (Sample) | $15,821 | $11,795 |
| Standard Deviation (Population) | $15,640 | $11,716 |
Similar Demographics by Median Male Earnings
Demographics Similar to Turks by Median Male Earnings
In terms of median male earnings, the demographic groups most similar to Turks are Immigrants from Switzerland ($63,944, a difference of 0.48%), Russian ($63,939, a difference of 0.49%), Immigrants from Denmark ($64,625, a difference of 0.58%), Asian ($63,827, a difference of 0.67%), and Immigrants from France ($63,715, a difference of 0.84%).
| Demographics | Rating | Rank | Median Male Earnings |
| Cypriots | 100.0 /100 | #19 | Exceptional $65,549 |
| Immigrants | Japan | 100.0 /100 | #20 | Exceptional $65,518 |
| Immigrants | Sweden | 100.0 /100 | #21 | Exceptional $65,406 |
| Burmese | 100.0 /100 | #22 | Exceptional $65,236 |
| Immigrants | Korea | 100.0 /100 | #23 | Exceptional $65,079 |
| Immigrants | Northern Europe | 100.0 /100 | #24 | Exceptional $64,987 |
| Immigrants | Denmark | 100.0 /100 | #25 | Exceptional $64,625 |
| Turks | 100.0 /100 | #26 | Exceptional $64,253 |
| Immigrants | Switzerland | 100.0 /100 | #27 | Exceptional $63,944 |
| Russians | 100.0 /100 | #28 | Exceptional $63,939 |
| Asians | 100.0 /100 | #29 | Exceptional $63,827 |
| Immigrants | France | 100.0 /100 | #30 | Exceptional $63,715 |
| Latvians | 100.0 /100 | #31 | Exceptional $63,498 |
| Soviet Union | 100.0 /100 | #32 | Exceptional $63,382 |
| Immigrants | Lithuania | 100.0 /100 | #33 | Exceptional $63,346 |
Demographics Similar to Immigrants from Eastern Africa by Median Male Earnings
In terms of median male earnings, the demographic groups most similar to Immigrants from Eastern Africa are Immigrants from Eritrea ($53,715, a difference of 0.0%), Puget Sound Salish ($53,704, a difference of 0.020%), Uruguayan ($53,680, a difference of 0.060%), Guamanian/Chamorro ($53,661, a difference of 0.10%), and Scotch-Irish ($53,658, a difference of 0.10%).
| Demographics | Rating | Rank | Median Male Earnings |
| Immigrants | Immigrants | 42.1 /100 | #181 | Average $54,168 |
| Yugoslavians | 37.4 /100 | #182 | Fair $53,967 |
| Immigrants | South America | 37.3 /100 | #183 | Fair $53,962 |
| Whites/Caucasians | 36.5 /100 | #184 | Fair $53,925 |
| Immigrants | Sierra Leone | 36.0 /100 | #185 | Fair $53,905 |
| Colombians | 34.4 /100 | #186 | Fair $53,832 |
| Immigrants | Eritrea | 31.8 /100 | #187 | Fair $53,715 |
| Immigrants | Eastern Africa | 31.8 /100 | #188 | Fair $53,713 |
| Puget Sound Salish | 31.6 /100 | #189 | Fair $53,704 |
| Uruguayans | 31.1 /100 | #190 | Fair $53,680 |
| Guamanians/Chamorros | 30.7 /100 | #191 | Fair $53,661 |
| Scotch-Irish | 30.6 /100 | #192 | Fair $53,658 |
| Kenyans | 30.4 /100 | #193 | Fair $53,647 |
| Spanish | 29.0 /100 | #194 | Fair $53,576 |
| Immigrants | Azores | 27.5 /100 | #195 | Fair $53,503 |