Turkish vs Immigrants from Morocco Median Female Earnings
COMPARE
Turkish
Immigrants from Morocco
Median Female Earnings
Median Female Earnings Comparison
Turks
Immigrants from Morocco
$44,695
MEDIAN FEMALE EARNINGS
100.0/ 100
METRIC RATING
27th/ 347
METRIC RANK
$42,229
MEDIAN FEMALE EARNINGS
99.5/ 100
METRIC RATING
82nd/ 347
METRIC RANK
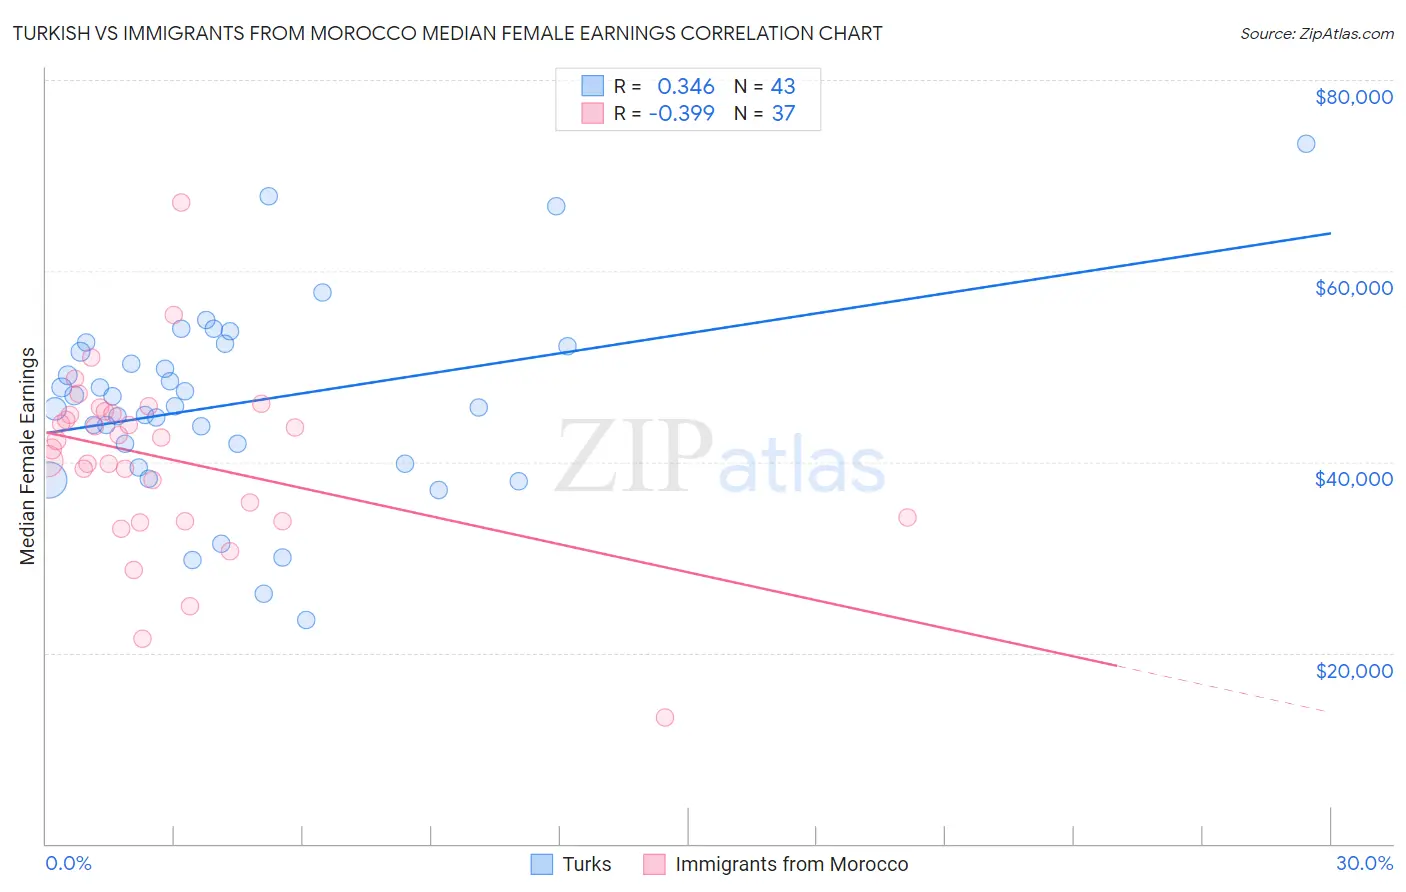
Turkish vs Immigrants from Morocco Median Female Earnings Correlation Chart
The statistical analysis conducted on geographies consisting of 271,816,857 people shows a mild positive correlation between the proportion of Turks and median female earnings in the United States with a correlation coefficient (R) of 0.346 and weighted average of $44,695. Similarly, the statistical analysis conducted on geographies consisting of 178,902,158 people shows a mild negative correlation between the proportion of Immigrants from Morocco and median female earnings in the United States with a correlation coefficient (R) of -0.399 and weighted average of $42,229, a difference of 5.8%.
Median Female Earnings Correlation Summary
| Measurement | Turkish | Immigrants from Morocco |
| Minimum | $23,409 | $13,173 |
| Maximum | $73,333 | $67,179 |
| Range | $49,924 | $54,006 |
| Mean | $46,115 | $40,274 |
| Median | $45,875 | $42,277 |
| Interquartile 25% (IQ1) | $39,746 | $34,012 |
| Interquartile 75% (IQ3) | $52,083 | $45,224 |
| Interquartile Range (IQR) | $12,337 | $11,212 |
| Standard Deviation (Sample) | $10,119 | $9,469 |
| Standard Deviation (Population) | $10,000 | $9,340 |
Similar Demographics by Median Female Earnings
Demographics Similar to Turks by Median Female Earnings
In terms of median female earnings, the demographic groups most similar to Turks are Immigrants from Russia ($44,680, a difference of 0.030%), Immigrants from Belarus ($44,757, a difference of 0.14%), Immigrants from Sweden ($44,774, a difference of 0.18%), Immigrants from Belgium ($44,587, a difference of 0.24%), and Asian ($44,586, a difference of 0.24%).
| Demographics | Rating | Rank | Median Female Earnings |
| Immigrants | Japan | 100.0 /100 | #20 | Exceptional $45,323 |
| Cambodians | 100.0 /100 | #21 | Exceptional $45,014 |
| Immigrants | Greece | 100.0 /100 | #22 | Exceptional $44,976 |
| Burmese | 100.0 /100 | #23 | Exceptional $44,911 |
| Immigrants | Korea | 100.0 /100 | #24 | Exceptional $44,847 |
| Immigrants | Sweden | 100.0 /100 | #25 | Exceptional $44,774 |
| Immigrants | Belarus | 100.0 /100 | #26 | Exceptional $44,757 |
| Turks | 100.0 /100 | #27 | Exceptional $44,695 |
| Immigrants | Russia | 100.0 /100 | #28 | Exceptional $44,680 |
| Immigrants | Belgium | 100.0 /100 | #29 | Exceptional $44,587 |
| Asians | 100.0 /100 | #30 | Exceptional $44,586 |
| Immigrants | France | 100.0 /100 | #31 | Exceptional $44,541 |
| Immigrants | Northern Europe | 100.0 /100 | #32 | Exceptional $44,366 |
| Immigrants | Asia | 100.0 /100 | #33 | Exceptional $44,198 |
| Russians | 100.0 /100 | #34 | Exceptional $44,169 |
Demographics Similar to Immigrants from Morocco by Median Female Earnings
In terms of median female earnings, the demographic groups most similar to Immigrants from Morocco are Immigrants from Sierra Leone ($42,214, a difference of 0.030%), Armenian ($42,212, a difference of 0.040%), Immigrants from Southern Europe ($42,275, a difference of 0.11%), Immigrants from Moldova ($42,304, a difference of 0.18%), and Laotian ($42,133, a difference of 0.23%).
| Demographics | Rating | Rank | Median Female Earnings |
| New Zealanders | 99.7 /100 | #75 | Exceptional $42,446 |
| Immigrants | Italy | 99.7 /100 | #76 | Exceptional $42,446 |
| Immigrants | Albania | 99.6 /100 | #77 | Exceptional $42,388 |
| Immigrants | Kazakhstan | 99.6 /100 | #78 | Exceptional $42,386 |
| Greeks | 99.6 /100 | #79 | Exceptional $42,336 |
| Immigrants | Moldova | 99.6 /100 | #80 | Exceptional $42,304 |
| Immigrants | Southern Europe | 99.5 /100 | #81 | Exceptional $42,275 |
| Immigrants | Morocco | 99.5 /100 | #82 | Exceptional $42,229 |
| Immigrants | Sierra Leone | 99.5 /100 | #83 | Exceptional $42,214 |
| Armenians | 99.5 /100 | #84 | Exceptional $42,212 |
| Laotians | 99.4 /100 | #85 | Exceptional $42,133 |
| Immigrants | St. Vincent and the Grenadines | 99.3 /100 | #86 | Exceptional $42,108 |
| Lithuanians | 99.3 /100 | #87 | Exceptional $42,108 |
| Immigrants | Northern Africa | 99.3 /100 | #88 | Exceptional $42,084 |
| Immigrants | Afghanistan | 99.3 /100 | #89 | Exceptional $42,055 |