Turkish vs Bermudan Median Female Earnings
COMPARE
Turkish
Bermudan
Median Female Earnings
Median Female Earnings Comparison
Turks
Bermudans
$44,695
MEDIAN FEMALE EARNINGS
100.0/ 100
METRIC RATING
27th/ 347
METRIC RANK
$39,418
MEDIAN FEMALE EARNINGS
35.9/ 100
METRIC RATING
188th/ 347
METRIC RANK
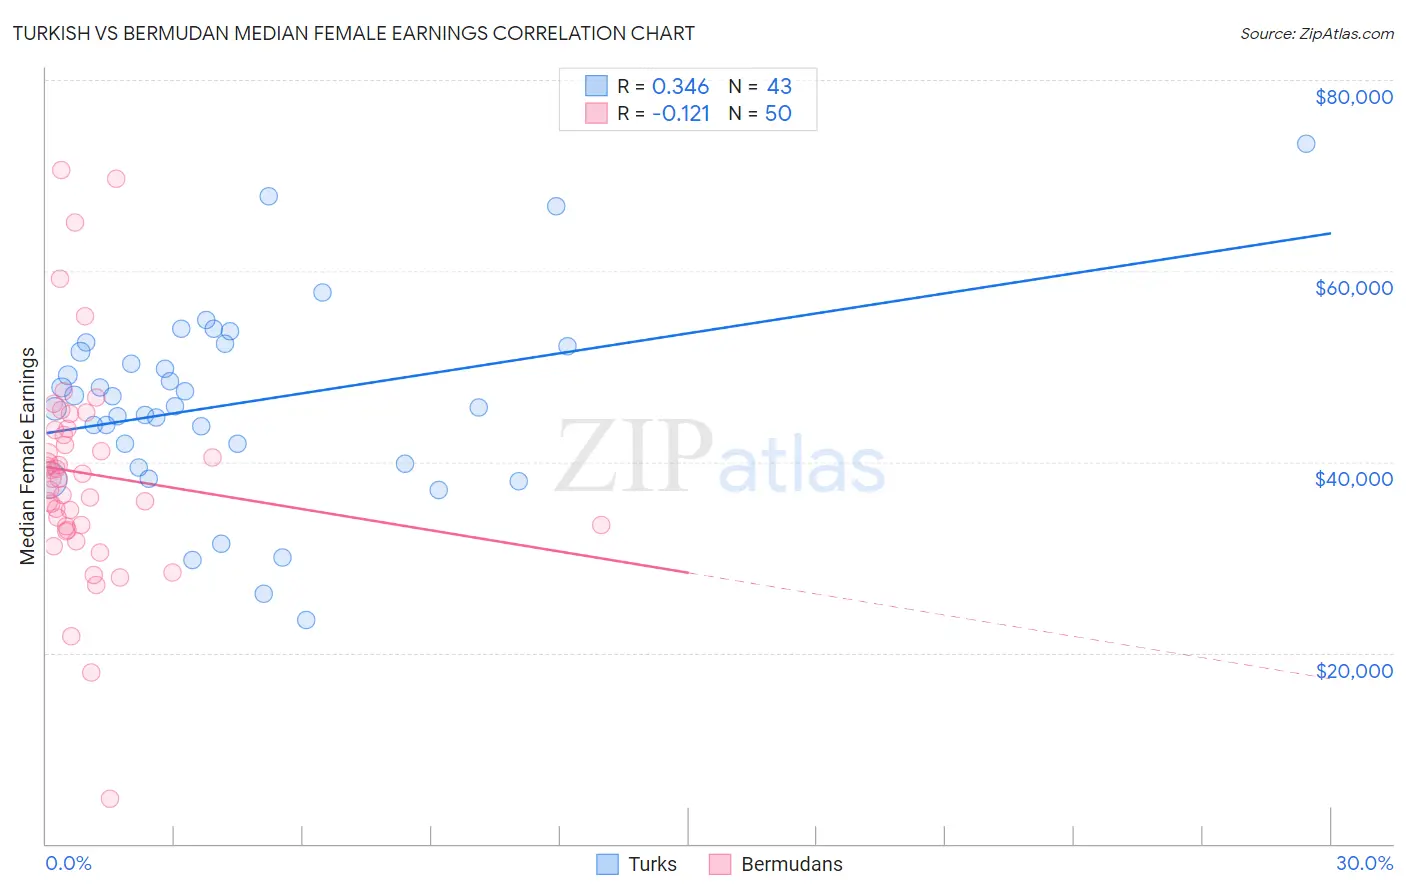
Turkish vs Bermudan Median Female Earnings Correlation Chart
The statistical analysis conducted on geographies consisting of 271,816,857 people shows a mild positive correlation between the proportion of Turks and median female earnings in the United States with a correlation coefficient (R) of 0.346 and weighted average of $44,695. Similarly, the statistical analysis conducted on geographies consisting of 55,724,642 people shows a poor negative correlation between the proportion of Bermudans and median female earnings in the United States with a correlation coefficient (R) of -0.121 and weighted average of $39,418, a difference of 13.4%.
Median Female Earnings Correlation Summary
| Measurement | Turkish | Bermudan |
| Minimum | $23,409 | $4,682 |
| Maximum | $73,333 | $70,590 |
| Range | $49,924 | $65,908 |
| Mean | $46,115 | $38,764 |
| Median | $45,875 | $38,256 |
| Interquartile 25% (IQ1) | $39,746 | $33,240 |
| Interquartile 75% (IQ3) | $52,083 | $43,282 |
| Interquartile Range (IQR) | $12,337 | $10,042 |
| Standard Deviation (Sample) | $10,119 | $11,556 |
| Standard Deviation (Population) | $10,000 | $11,440 |
Similar Demographics by Median Female Earnings
Demographics Similar to Turks by Median Female Earnings
In terms of median female earnings, the demographic groups most similar to Turks are Immigrants from Russia ($44,680, a difference of 0.030%), Immigrants from Belarus ($44,757, a difference of 0.14%), Immigrants from Sweden ($44,774, a difference of 0.18%), Immigrants from Belgium ($44,587, a difference of 0.24%), and Asian ($44,586, a difference of 0.24%).
| Demographics | Rating | Rank | Median Female Earnings |
| Immigrants | Japan | 100.0 /100 | #20 | Exceptional $45,323 |
| Cambodians | 100.0 /100 | #21 | Exceptional $45,014 |
| Immigrants | Greece | 100.0 /100 | #22 | Exceptional $44,976 |
| Burmese | 100.0 /100 | #23 | Exceptional $44,911 |
| Immigrants | Korea | 100.0 /100 | #24 | Exceptional $44,847 |
| Immigrants | Sweden | 100.0 /100 | #25 | Exceptional $44,774 |
| Immigrants | Belarus | 100.0 /100 | #26 | Exceptional $44,757 |
| Turks | 100.0 /100 | #27 | Exceptional $44,695 |
| Immigrants | Russia | 100.0 /100 | #28 | Exceptional $44,680 |
| Immigrants | Belgium | 100.0 /100 | #29 | Exceptional $44,587 |
| Asians | 100.0 /100 | #30 | Exceptional $44,586 |
| Immigrants | France | 100.0 /100 | #31 | Exceptional $44,541 |
| Immigrants | Northern Europe | 100.0 /100 | #32 | Exceptional $44,366 |
| Immigrants | Asia | 100.0 /100 | #33 | Exceptional $44,198 |
| Russians | 100.0 /100 | #34 | Exceptional $44,169 |
Demographics Similar to Bermudans by Median Female Earnings
In terms of median female earnings, the demographic groups most similar to Bermudans are Swedish ($39,421, a difference of 0.010%), Colombian ($39,439, a difference of 0.050%), Immigrants from West Indies ($39,441, a difference of 0.060%), Senegalese ($39,384, a difference of 0.090%), and European ($39,457, a difference of 0.10%).
| Demographics | Rating | Rank | Median Female Earnings |
| Tsimshian | 41.4 /100 | #181 | Average $39,530 |
| Tlingit-Haida | 40.5 /100 | #182 | Average $39,513 |
| Hungarians | 40.3 /100 | #183 | Average $39,510 |
| Europeans | 37.7 /100 | #184 | Fair $39,457 |
| Immigrants | West Indies | 36.9 /100 | #185 | Fair $39,441 |
| Colombians | 36.9 /100 | #186 | Fair $39,439 |
| Swedes | 36.0 /100 | #187 | Fair $39,421 |
| Bermudans | 35.9 /100 | #188 | Fair $39,418 |
| Senegalese | 34.2 /100 | #189 | Fair $39,384 |
| Puget Sound Salish | 33.9 /100 | #190 | Fair $39,376 |
| Immigrants | Western Africa | 32.7 /100 | #191 | Fair $39,351 |
| Immigrants | Immigrants | 31.7 /100 | #192 | Fair $39,328 |
| Immigrants | Nigeria | 30.2 /100 | #193 | Fair $39,294 |
| Irish | 30.0 /100 | #194 | Fair $39,291 |
| Uruguayans | 27.3 /100 | #195 | Fair $39,228 |