Turkish vs Immigrants from Malaysia Median Female Earnings
COMPARE
Turkish
Immigrants from Malaysia
Median Female Earnings
Median Female Earnings Comparison
Turks
Immigrants from Malaysia
$44,695
MEDIAN FEMALE EARNINGS
100.0/ 100
METRIC RATING
27th/ 347
METRIC RANK
$43,835
MEDIAN FEMALE EARNINGS
100.0/ 100
METRIC RATING
40th/ 347
METRIC RANK
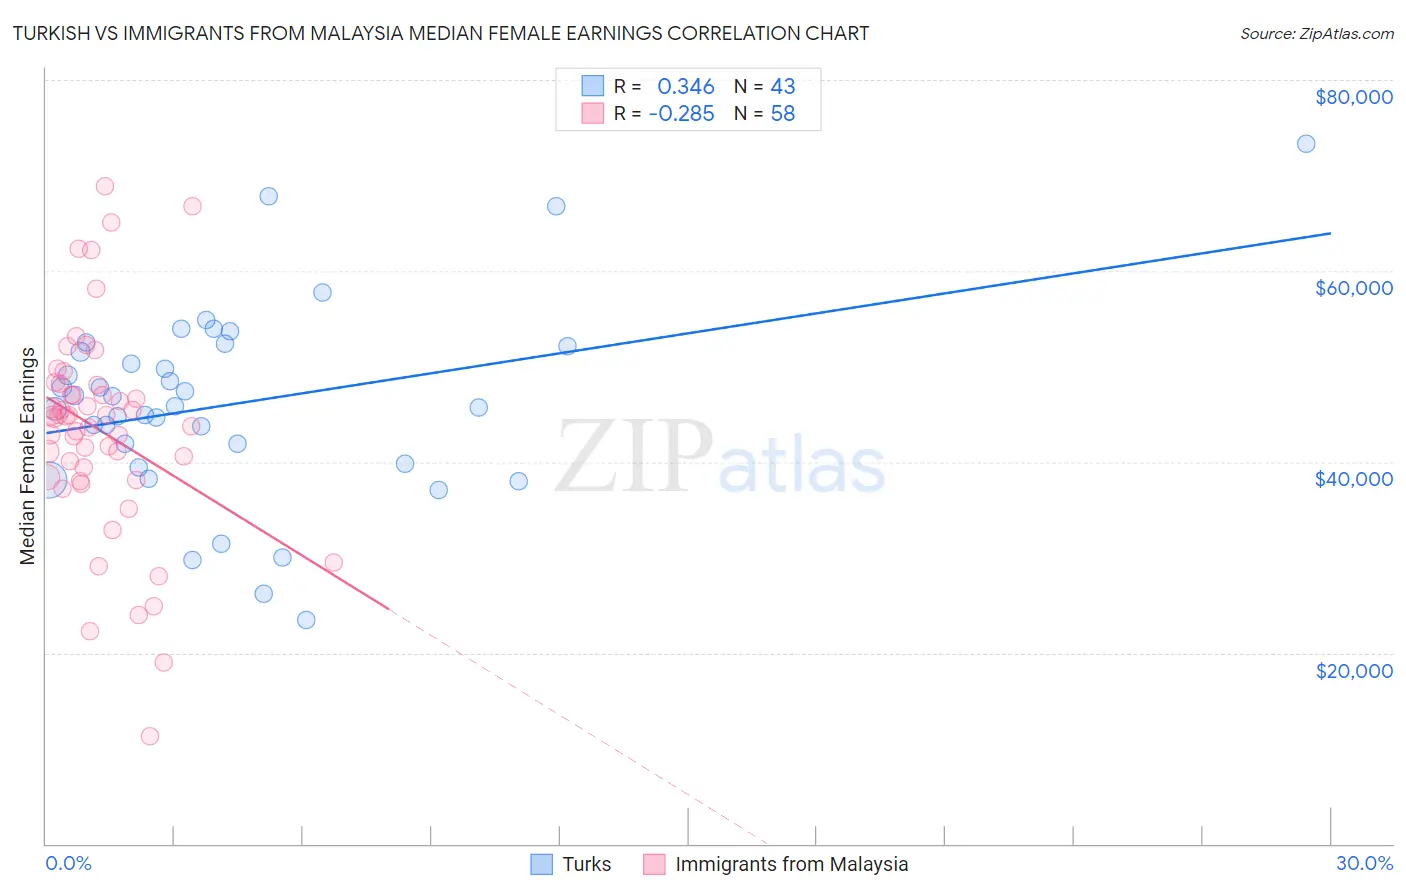
Turkish vs Immigrants from Malaysia Median Female Earnings Correlation Chart
The statistical analysis conducted on geographies consisting of 271,816,857 people shows a mild positive correlation between the proportion of Turks and median female earnings in the United States with a correlation coefficient (R) of 0.346 and weighted average of $44,695. Similarly, the statistical analysis conducted on geographies consisting of 197,943,431 people shows a weak negative correlation between the proportion of Immigrants from Malaysia and median female earnings in the United States with a correlation coefficient (R) of -0.285 and weighted average of $43,835, a difference of 2.0%.
Median Female Earnings Correlation Summary
| Measurement | Turkish | Immigrants from Malaysia |
| Minimum | $23,409 | $11,250 |
| Maximum | $73,333 | $68,919 |
| Range | $49,924 | $57,669 |
| Mean | $46,115 | $43,300 |
| Median | $45,875 | $44,670 |
| Interquartile 25% (IQ1) | $39,746 | $38,363 |
| Interquartile 75% (IQ3) | $52,083 | $48,104 |
| Interquartile Range (IQR) | $12,337 | $9,741 |
| Standard Deviation (Sample) | $10,119 | $11,057 |
| Standard Deviation (Population) | $10,000 | $10,961 |
Demographics Similar to Turks and Immigrants from Malaysia by Median Female Earnings
In terms of median female earnings, the demographic groups most similar to Turks are Immigrants from Russia ($44,680, a difference of 0.030%), Immigrants from Belarus ($44,757, a difference of 0.14%), Immigrants from Sweden ($44,774, a difference of 0.18%), Immigrants from Belgium ($44,587, a difference of 0.24%), and Asian ($44,586, a difference of 0.24%). Similarly, the demographic groups most similar to Immigrants from Malaysia are Israeli ($43,852, a difference of 0.040%), Latvian ($43,941, a difference of 0.24%), Immigrants from Switzerland ($43,996, a difference of 0.37%), Bhutanese ($43,648, a difference of 0.43%), and Immigrants from Denmark ($43,646, a difference of 0.43%).
| Demographics | Rating | Rank | Median Female Earnings |
| Burmese | 100.0 /100 | #23 | Exceptional $44,911 |
| Immigrants | Korea | 100.0 /100 | #24 | Exceptional $44,847 |
| Immigrants | Sweden | 100.0 /100 | #25 | Exceptional $44,774 |
| Immigrants | Belarus | 100.0 /100 | #26 | Exceptional $44,757 |
| Turks | 100.0 /100 | #27 | Exceptional $44,695 |
| Immigrants | Russia | 100.0 /100 | #28 | Exceptional $44,680 |
| Immigrants | Belgium | 100.0 /100 | #29 | Exceptional $44,587 |
| Asians | 100.0 /100 | #30 | Exceptional $44,586 |
| Immigrants | France | 100.0 /100 | #31 | Exceptional $44,541 |
| Immigrants | Northern Europe | 100.0 /100 | #32 | Exceptional $44,366 |
| Immigrants | Asia | 100.0 /100 | #33 | Exceptional $44,198 |
| Russians | 100.0 /100 | #34 | Exceptional $44,169 |
| Immigrants | Sri Lanka | 100.0 /100 | #35 | Exceptional $44,161 |
| Immigrants | Turkey | 100.0 /100 | #36 | Exceptional $44,066 |
| Immigrants | Switzerland | 100.0 /100 | #37 | Exceptional $43,996 |
| Latvians | 100.0 /100 | #38 | Exceptional $43,941 |
| Israelis | 100.0 /100 | #39 | Exceptional $43,852 |
| Immigrants | Malaysia | 100.0 /100 | #40 | Exceptional $43,835 |
| Bhutanese | 100.0 /100 | #41 | Exceptional $43,648 |
| Immigrants | Denmark | 100.0 /100 | #42 | Exceptional $43,646 |
| Bulgarians | 100.0 /100 | #43 | Exceptional $43,638 |