Tsimshian vs Japanese Median Earnings
COMPARE
Tsimshian
Japanese
Median Earnings
Median Earnings Comparison
Tsimshian
Japanese
$43,695
MEDIAN EARNINGS
2.1/ 100
METRIC RATING
251st/ 347
METRIC RANK
$44,825
MEDIAN EARNINGS
9.5/ 100
METRIC RATING
231st/ 347
METRIC RANK
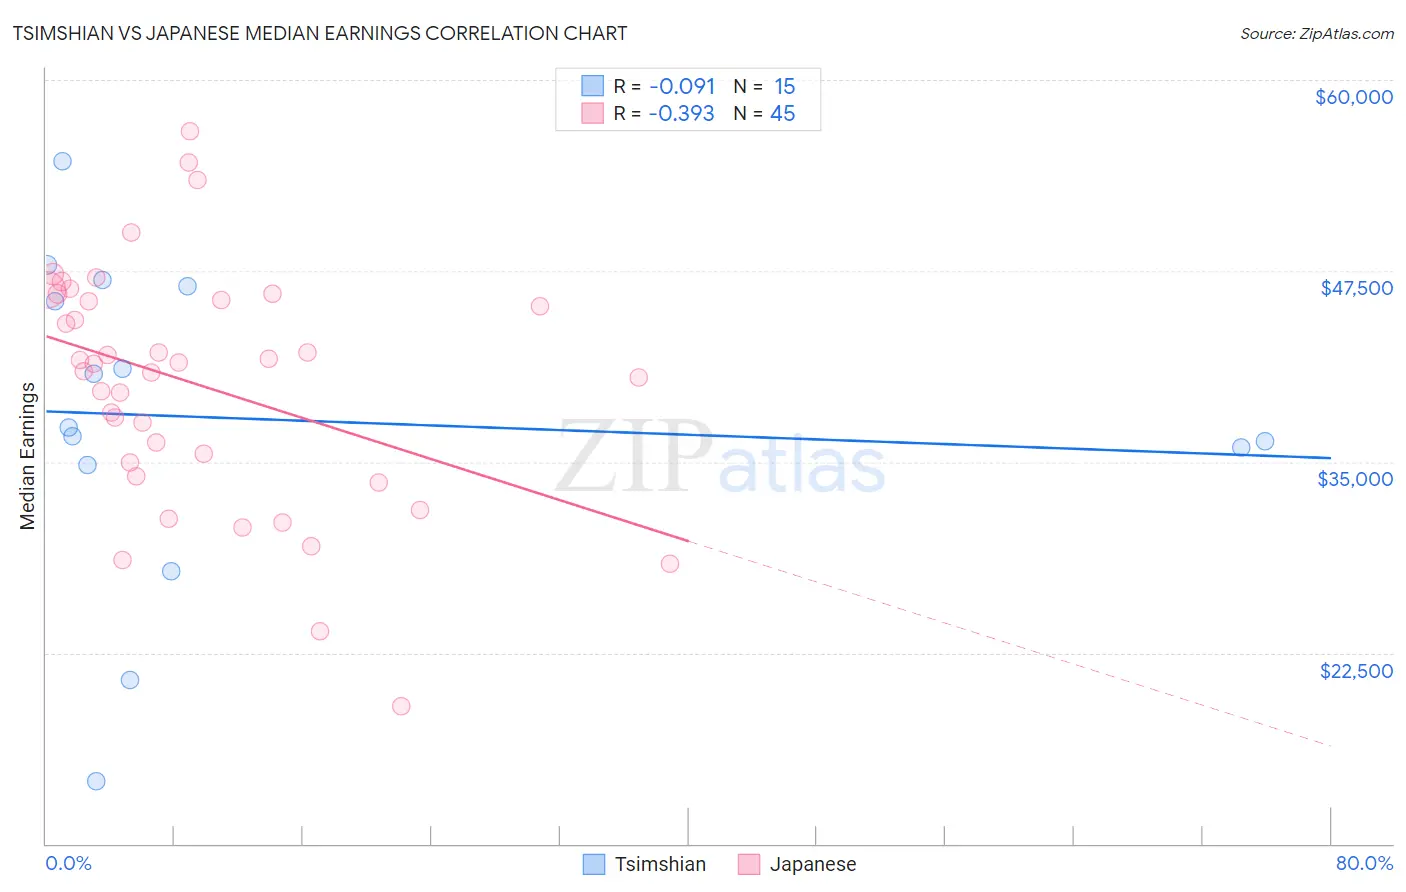
Tsimshian vs Japanese Median Earnings Correlation Chart
The statistical analysis conducted on geographies consisting of 15,626,544 people shows a slight negative correlation between the proportion of Tsimshian and median earnings in the United States with a correlation coefficient (R) of -0.091 and weighted average of $43,695. Similarly, the statistical analysis conducted on geographies consisting of 249,187,165 people shows a mild negative correlation between the proportion of Japanese and median earnings in the United States with a correlation coefficient (R) of -0.393 and weighted average of $44,825, a difference of 2.6%.
Median Earnings Correlation Summary
| Measurement | Tsimshian | Japanese |
| Minimum | $14,091 | $19,004 |
| Maximum | $54,691 | $56,680 |
| Range | $40,600 | $37,676 |
| Mean | $37,810 | $40,035 |
| Median | $37,241 | $41,417 |
| Interquartile 25% (IQ1) | $34,814 | $34,525 |
| Interquartile 75% (IQ3) | $46,528 | $45,796 |
| Interquartile Range (IQR) | $11,714 | $11,271 |
| Standard Deviation (Sample) | $10,670 | $7,916 |
| Standard Deviation (Population) | $10,309 | $7,827 |
Demographics Similar to Tsimshian and Japanese by Median Earnings
In terms of median earnings, the demographic groups most similar to Tsimshian are Alaska Native ($43,750, a difference of 0.13%), Malaysian ($43,844, a difference of 0.34%), Nepalese ($43,860, a difference of 0.38%), Immigrants from Cabo Verde ($43,963, a difference of 0.61%), and Immigrants from West Indies ($43,989, a difference of 0.67%). Similarly, the demographic groups most similar to Japanese are Delaware ($44,783, a difference of 0.090%), Immigrants from Sudan ($44,767, a difference of 0.13%), Cape Verdean ($44,640, a difference of 0.41%), Venezuelan ($44,580, a difference of 0.55%), and British West Indian ($44,552, a difference of 0.61%).
| Demographics | Rating | Rank | Median Earnings |
| Japanese | 9.5 /100 | #231 | Tragic $44,825 |
| Delaware | 9.0 /100 | #232 | Tragic $44,783 |
| Immigrants | Sudan | 8.8 /100 | #233 | Tragic $44,767 |
| Cape Verdeans | 7.5 /100 | #234 | Tragic $44,640 |
| Venezuelans | 6.9 /100 | #235 | Tragic $44,580 |
| British West Indians | 6.7 /100 | #236 | Tragic $44,552 |
| Immigrants | Ecuador | 5.9 /100 | #237 | Tragic $44,462 |
| Sudanese | 5.6 /100 | #238 | Tragic $44,419 |
| Senegalese | 5.3 /100 | #239 | Tragic $44,373 |
| Aleuts | 4.4 /100 | #240 | Tragic $44,241 |
| Samoans | 4.2 /100 | #241 | Tragic $44,206 |
| Immigrants | Venezuela | 4.0 /100 | #242 | Tragic $44,163 |
| Sub-Saharan Africans | 3.7 /100 | #243 | Tragic $44,118 |
| Immigrants | Nonimmigrants | 3.7 /100 | #244 | Tragic $44,117 |
| Immigrants | Burma/Myanmar | 3.2 /100 | #245 | Tragic $43,998 |
| Immigrants | West Indies | 3.1 /100 | #246 | Tragic $43,989 |
| Immigrants | Cabo Verde | 3.0 /100 | #247 | Tragic $43,963 |
| Nepalese | 2.6 /100 | #248 | Tragic $43,860 |
| Malaysians | 2.6 /100 | #249 | Tragic $43,844 |
| Alaska Natives | 2.3 /100 | #250 | Tragic $43,750 |
| Tsimshian | 2.1 /100 | #251 | Tragic $43,695 |