Tsimshian vs Native Hawaiian Median Earnings
COMPARE
Tsimshian
Native Hawaiian
Median Earnings
Median Earnings Comparison
Tsimshian
Native Hawaiians
$43,695
MEDIAN EARNINGS
2.1/ 100
METRIC RATING
251st/ 347
METRIC RANK
$45,027
MEDIAN EARNINGS
12.2/ 100
METRIC RATING
227th/ 347
METRIC RANK
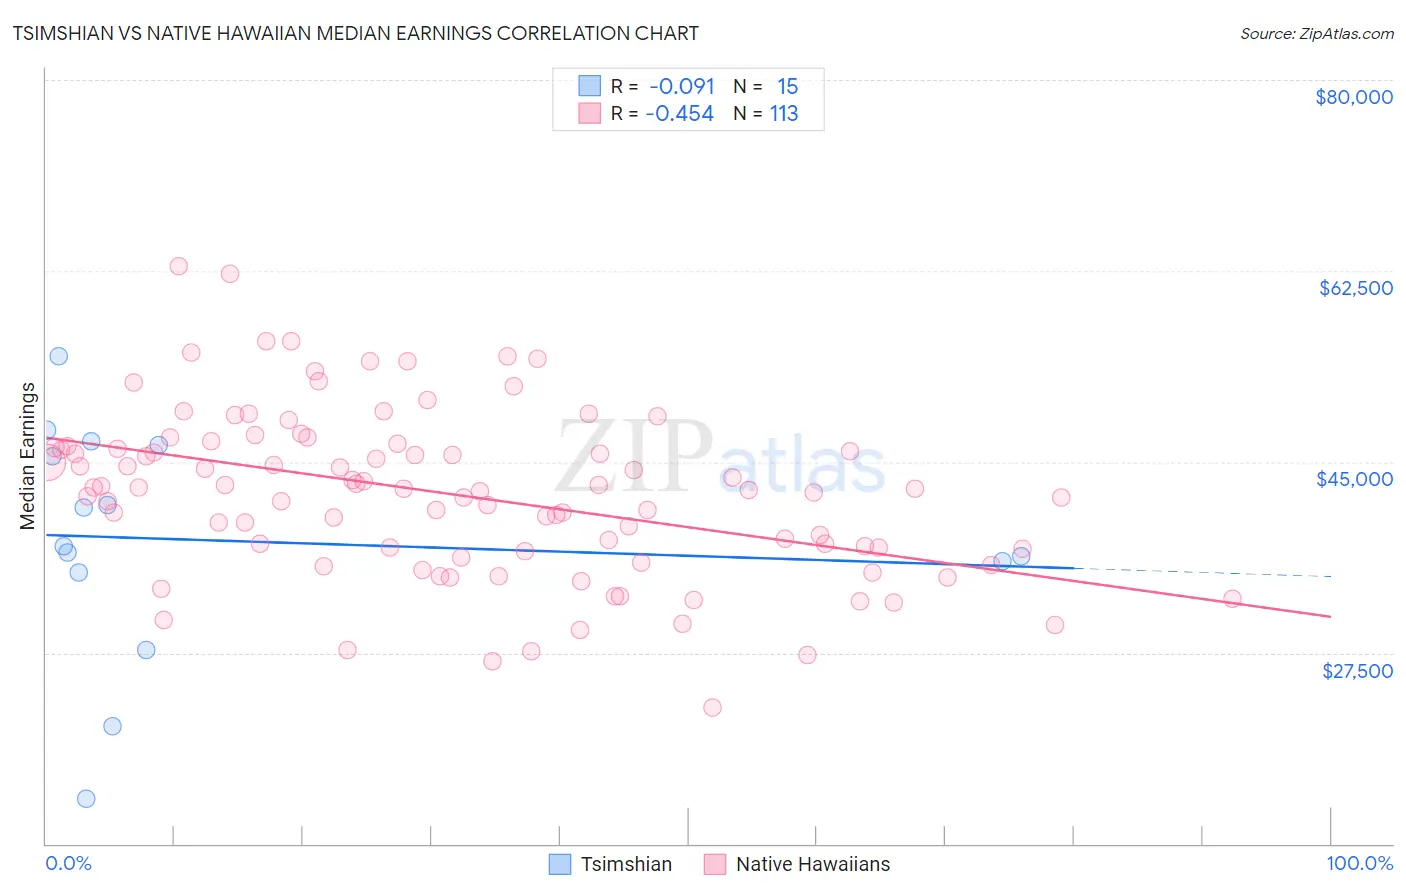
Tsimshian vs Native Hawaiian Median Earnings Correlation Chart
The statistical analysis conducted on geographies consisting of 15,626,544 people shows a slight negative correlation between the proportion of Tsimshian and median earnings in the United States with a correlation coefficient (R) of -0.091 and weighted average of $43,695. Similarly, the statistical analysis conducted on geographies consisting of 332,103,903 people shows a moderate negative correlation between the proportion of Native Hawaiians and median earnings in the United States with a correlation coefficient (R) of -0.454 and weighted average of $45,027, a difference of 3.0%.
Median Earnings Correlation Summary
| Measurement | Tsimshian | Native Hawaiian |
| Minimum | $14,091 | $22,468 |
| Maximum | $54,691 | $62,910 |
| Range | $40,600 | $40,442 |
| Mean | $37,810 | $42,021 |
| Median | $37,241 | $42,485 |
| Interquartile 25% (IQ1) | $34,814 | $36,941 |
| Interquartile 75% (IQ3) | $46,528 | $46,349 |
| Interquartile Range (IQR) | $11,714 | $9,407 |
| Standard Deviation (Sample) | $10,670 | $7,647 |
| Standard Deviation (Population) | $10,309 | $7,613 |
Similar Demographics by Median Earnings
Demographics Similar to Tsimshian by Median Earnings
In terms of median earnings, the demographic groups most similar to Tsimshian are Hawaiian ($43,673, a difference of 0.050%), Alaska Native ($43,750, a difference of 0.13%), Somali ($43,567, a difference of 0.30%), Malaysian ($43,844, a difference of 0.34%), and Liberian ($43,536, a difference of 0.37%).
| Demographics | Rating | Rank | Median Earnings |
| Immigrants | Nonimmigrants | 3.7 /100 | #244 | Tragic $44,117 |
| Immigrants | Burma/Myanmar | 3.2 /100 | #245 | Tragic $43,998 |
| Immigrants | West Indies | 3.1 /100 | #246 | Tragic $43,989 |
| Immigrants | Cabo Verde | 3.0 /100 | #247 | Tragic $43,963 |
| Nepalese | 2.6 /100 | #248 | Tragic $43,860 |
| Malaysians | 2.6 /100 | #249 | Tragic $43,844 |
| Alaska Natives | 2.3 /100 | #250 | Tragic $43,750 |
| Tsimshian | 2.1 /100 | #251 | Tragic $43,695 |
| Hawaiians | 2.0 /100 | #252 | Tragic $43,673 |
| Somalis | 1.8 /100 | #253 | Tragic $43,567 |
| Liberians | 1.7 /100 | #254 | Tragic $43,536 |
| Immigrants | Middle Africa | 1.4 /100 | #255 | Tragic $43,416 |
| Alaskan Athabascans | 1.4 /100 | #256 | Tragic $43,393 |
| Jamaicans | 1.3 /100 | #257 | Tragic $43,343 |
| French American Indians | 1.3 /100 | #258 | Tragic $43,333 |
Demographics Similar to Native Hawaiians by Median Earnings
In terms of median earnings, the demographic groups most similar to Native Hawaiians are Immigrants from Nigeria ($45,030, a difference of 0.010%), Immigrants from Iraq ($44,988, a difference of 0.090%), Immigrants from Cambodia ($45,090, a difference of 0.14%), West Indian ($45,132, a difference of 0.23%), and Scotch-Irish ($44,924, a difference of 0.23%).
| Demographics | Rating | Rank | Median Earnings |
| Ecuadorians | 15.3 /100 | #220 | Poor $45,214 |
| Immigrants | Guyana | 15.1 /100 | #221 | Poor $45,204 |
| Immigrants | Panama | 15.0 /100 | #222 | Poor $45,198 |
| Whites/Caucasians | 15.0 /100 | #223 | Poor $45,197 |
| West Indians | 13.9 /100 | #224 | Poor $45,132 |
| Immigrants | Cambodia | 13.2 /100 | #225 | Poor $45,090 |
| Immigrants | Nigeria | 12.2 /100 | #226 | Poor $45,030 |
| Native Hawaiians | 12.2 /100 | #227 | Poor $45,027 |
| Immigrants | Iraq | 11.6 /100 | #228 | Poor $44,988 |
| Scotch-Irish | 10.7 /100 | #229 | Poor $44,924 |
| Immigrants | Western Africa | 10.3 /100 | #230 | Poor $44,893 |
| Japanese | 9.5 /100 | #231 | Tragic $44,825 |
| Delaware | 9.0 /100 | #232 | Tragic $44,783 |
| Immigrants | Sudan | 8.8 /100 | #233 | Tragic $44,767 |
| Cape Verdeans | 7.5 /100 | #234 | Tragic $44,640 |