Tsimshian vs Indonesian 10th Grade
COMPARE
Tsimshian
Indonesian
10th Grade
10th Grade Comparison
Tsimshian
Indonesians
95.6%
10TH GRADE
100.0/ 100
METRIC RATING
14th/ 347
METRIC RANK
91.8%
10TH GRADE
0.0/ 100
METRIC RATING
293rd/ 347
METRIC RANK
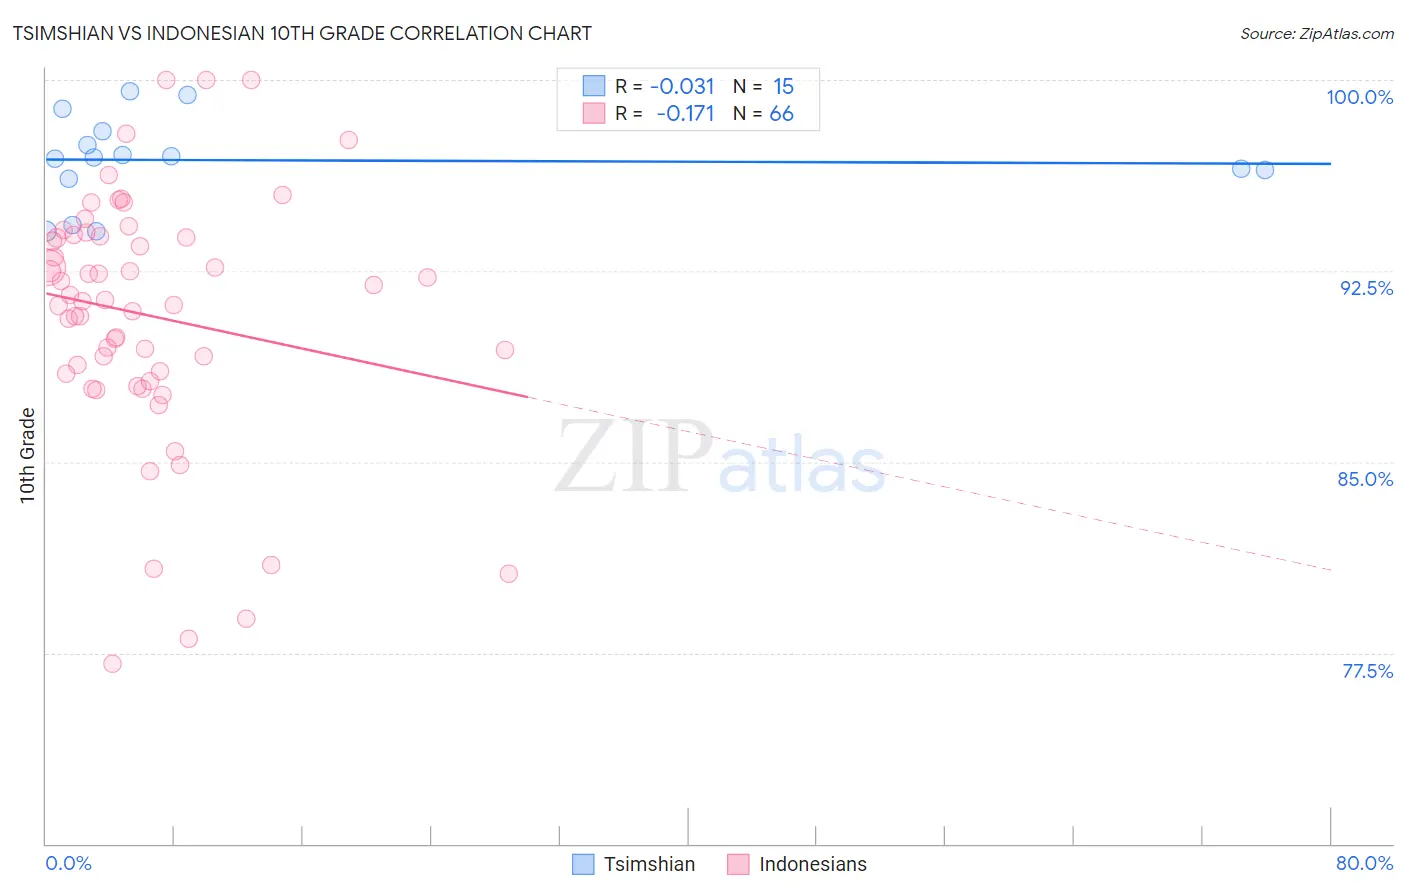
Tsimshian vs Indonesian 10th Grade Correlation Chart
The statistical analysis conducted on geographies consisting of 15,626,544 people shows no correlation between the proportion of Tsimshian and percentage of population with at least 10th grade education in the United States with a correlation coefficient (R) of -0.031 and weighted average of 95.6%. Similarly, the statistical analysis conducted on geographies consisting of 162,727,113 people shows a poor negative correlation between the proportion of Indonesians and percentage of population with at least 10th grade education in the United States with a correlation coefficient (R) of -0.171 and weighted average of 91.8%, a difference of 4.2%.
10th Grade Correlation Summary
| Measurement | Tsimshian | Indonesian |
| Minimum | 94.0% | 77.1% |
| Maximum | 99.6% | 100.0% |
| Range | 5.5% | 22.9% |
| Mean | 96.8% | 90.7% |
| Median | 96.9% | 91.3% |
| Interquartile 25% (IQ1) | 96.1% | 88.5% |
| Interquartile 75% (IQ3) | 98.0% | 93.9% |
| Interquartile Range (IQR) | 1.9% | 5.4% |
| Standard Deviation (Sample) | 1.7% | 5.0% |
| Standard Deviation (Population) | 1.7% | 4.9% |
Similar Demographics by 10th Grade
Demographics Similar to Tsimshian by 10th Grade
In terms of 10th grade, the demographic groups most similar to Tsimshian are English (95.6%, a difference of 0.010%), Irish (95.6%, a difference of 0.020%), Scottish (95.6%, a difference of 0.030%), Tlingit-Haida (95.7%, a difference of 0.040%), and Latvian (95.6%, a difference of 0.040%).
| Demographics | Rating | Rank | 10th Grade |
| Germans | 100.0 /100 | #7 | Exceptional 95.8% |
| Lithuanians | 100.0 /100 | #8 | Exceptional 95.8% |
| Finns | 100.0 /100 | #9 | Exceptional 95.8% |
| Croatians | 100.0 /100 | #10 | Exceptional 95.7% |
| Danes | 100.0 /100 | #11 | Exceptional 95.7% |
| Tlingit-Haida | 100.0 /100 | #12 | Exceptional 95.7% |
| English | 100.0 /100 | #13 | Exceptional 95.6% |
| Tsimshian | 100.0 /100 | #14 | Exceptional 95.6% |
| Irish | 100.0 /100 | #15 | Exceptional 95.6% |
| Scottish | 100.0 /100 | #16 | Exceptional 95.6% |
| Latvians | 100.0 /100 | #17 | Exceptional 95.6% |
| Italians | 100.0 /100 | #18 | Exceptional 95.6% |
| Scandinavians | 100.0 /100 | #19 | Exceptional 95.6% |
| Chinese | 100.0 /100 | #20 | Exceptional 95.5% |
| Dutch | 100.0 /100 | #21 | Exceptional 95.5% |
Demographics Similar to Indonesians by 10th Grade
In terms of 10th grade, the demographic groups most similar to Indonesians are Immigrants from West Indies (91.8%, a difference of 0.020%), Immigrants from Burma/Myanmar (91.8%, a difference of 0.020%), British West Indian (91.8%, a difference of 0.030%), Haitian (91.8%, a difference of 0.030%), and Sri Lankan (91.8%, a difference of 0.050%).
| Demographics | Rating | Rank | 10th Grade |
| Yuman | 0.0 /100 | #286 | Tragic 92.0% |
| Pennsylvania Germans | 0.0 /100 | #287 | Tragic 91.9% |
| Immigrants | Laos | 0.0 /100 | #288 | Tragic 91.9% |
| Sri Lankans | 0.0 /100 | #289 | Tragic 91.8% |
| British West Indians | 0.0 /100 | #290 | Tragic 91.8% |
| Immigrants | West Indies | 0.0 /100 | #291 | Tragic 91.8% |
| Immigrants | Burma/Myanmar | 0.0 /100 | #292 | Tragic 91.8% |
| Indonesians | 0.0 /100 | #293 | Tragic 91.8% |
| Haitians | 0.0 /100 | #294 | Tragic 91.8% |
| Lumbee | 0.0 /100 | #295 | Tragic 91.7% |
| Immigrants | Grenada | 0.0 /100 | #296 | Tragic 91.6% |
| Fijians | 0.0 /100 | #297 | Tragic 91.5% |
| Cubans | 0.0 /100 | #298 | Tragic 91.5% |
| Immigrants | Haiti | 0.0 /100 | #299 | Tragic 91.4% |
| Guyanese | 0.0 /100 | #300 | Tragic 91.4% |