Trinidadian and Tobagonian vs Australian Median Earnings
COMPARE
Trinidadian and Tobagonian
Australian
Median Earnings
Median Earnings Comparison
Trinidadians and Tobagonians
Australians
$45,820
MEDIAN EARNINGS
29.7/ 100
METRIC RATING
198th/ 347
METRIC RANK
$52,294
MEDIAN EARNINGS
100.0/ 100
METRIC RATING
47th/ 347
METRIC RANK
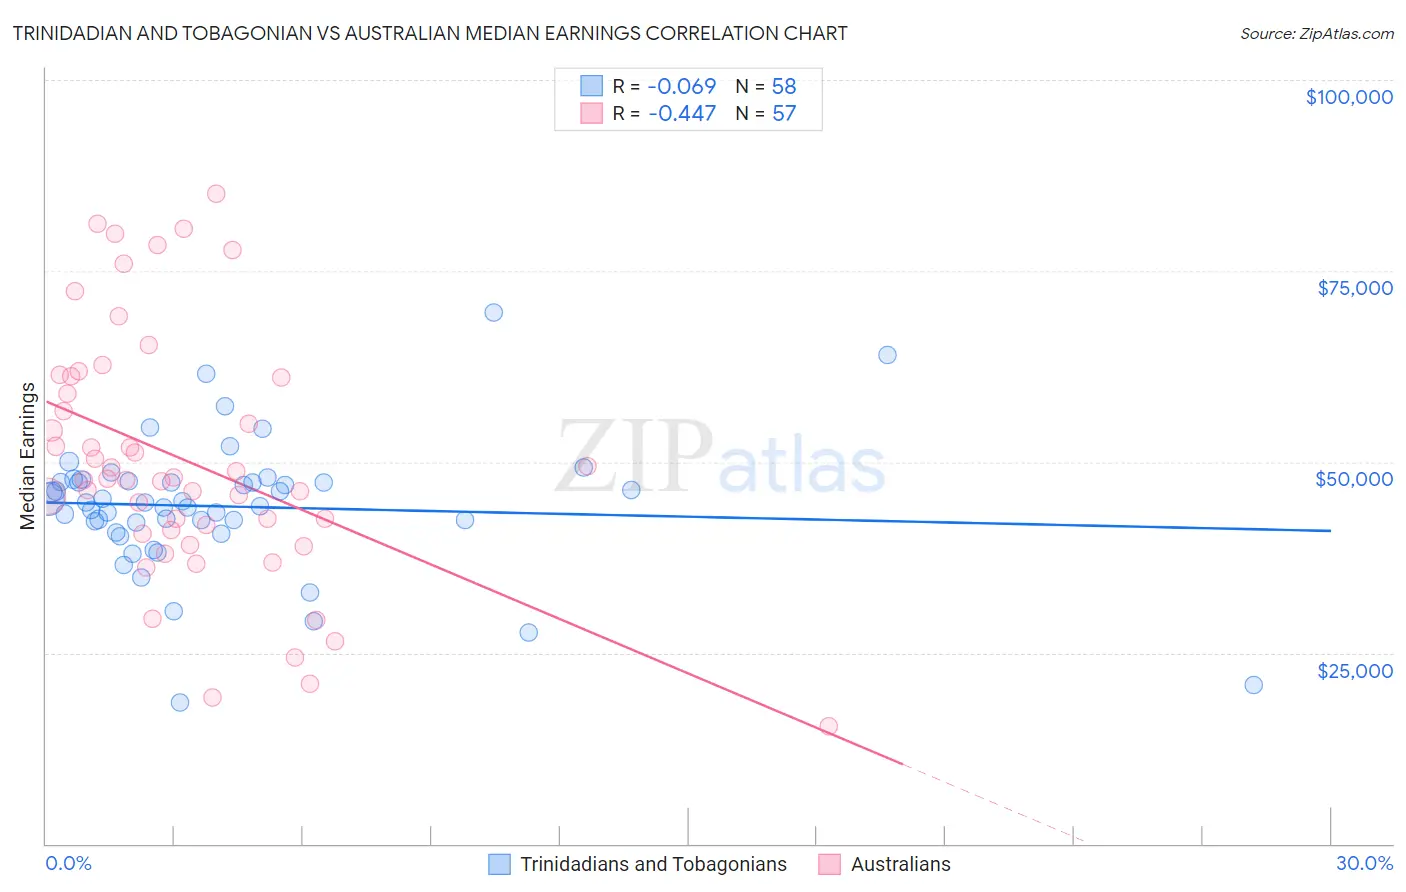
Trinidadian and Tobagonian vs Australian Median Earnings Correlation Chart
The statistical analysis conducted on geographies consisting of 219,864,725 people shows a slight negative correlation between the proportion of Trinidadians and Tobagonians and median earnings in the United States with a correlation coefficient (R) of -0.069 and weighted average of $45,820. Similarly, the statistical analysis conducted on geographies consisting of 224,158,339 people shows a moderate negative correlation between the proportion of Australians and median earnings in the United States with a correlation coefficient (R) of -0.447 and weighted average of $52,294, a difference of 14.1%.
Median Earnings Correlation Summary
| Measurement | Trinidadian and Tobagonian | Australian |
| Minimum | $18,432 | $15,451 |
| Maximum | $69,500 | $85,069 |
| Range | $51,068 | $69,618 |
| Mean | $44,150 | $50,151 |
| Median | $44,668 | $47,849 |
| Interquartile 25% (IQ1) | $42,022 | $40,819 |
| Interquartile 75% (IQ3) | $47,373 | $61,206 |
| Interquartile Range (IQR) | $5,351 | $20,387 |
| Standard Deviation (Sample) | $8,720 | $16,224 |
| Standard Deviation (Population) | $8,644 | $16,081 |
Similar Demographics by Median Earnings
Demographics Similar to Trinidadians and Tobagonians by Median Earnings
In terms of median earnings, the demographic groups most similar to Trinidadians and Tobagonians are Immigrants from Barbados ($45,816, a difference of 0.010%), Immigrants from the Azores ($45,812, a difference of 0.020%), Yugoslavian ($45,846, a difference of 0.060%), Barbadian ($45,846, a difference of 0.060%), and Immigrants from St. Vincent and the Grenadines ($45,908, a difference of 0.19%).
| Demographics | Rating | Rank | Median Earnings |
| Finns | 33.4 /100 | #191 | Fair $45,940 |
| Germans | 33.2 /100 | #192 | Fair $45,935 |
| Guamanians/Chamorros | 33.2 /100 | #193 | Fair $45,933 |
| Immigrants | Costa Rica | 33.0 /100 | #194 | Fair $45,928 |
| Immigrants | St. Vincent and the Grenadines | 32.4 /100 | #195 | Fair $45,908 |
| Yugoslavians | 30.5 /100 | #196 | Fair $45,846 |
| Barbadians | 30.5 /100 | #197 | Fair $45,846 |
| Trinidadians and Tobagonians | 29.7 /100 | #198 | Fair $45,820 |
| Immigrants | Barbados | 29.6 /100 | #199 | Fair $45,816 |
| Immigrants | Azores | 29.5 /100 | #200 | Fair $45,812 |
| Celtics | 27.2 /100 | #201 | Fair $45,732 |
| Immigrants | Trinidad and Tobago | 27.1 /100 | #202 | Fair $45,729 |
| Welsh | 26.6 /100 | #203 | Fair $45,710 |
| Immigrants | Uruguay | 25.9 /100 | #204 | Fair $45,682 |
| Tongans | 25.4 /100 | #205 | Fair $45,665 |
Demographics Similar to Australians by Median Earnings
In terms of median earnings, the demographic groups most similar to Australians are Bhutanese ($52,297, a difference of 0.010%), Immigrants from Czechoslovakia ($52,361, a difference of 0.13%), Immigrants from Europe ($52,195, a difference of 0.19%), Immigrants from Malaysia ($52,514, a difference of 0.42%), and Bulgarian ($52,512, a difference of 0.42%).
| Demographics | Rating | Rank | Median Earnings |
| Israelis | 100.0 /100 | #40 | Exceptional $52,937 |
| Immigrants | Lithuania | 100.0 /100 | #41 | Exceptional $52,769 |
| Maltese | 100.0 /100 | #42 | Exceptional $52,526 |
| Immigrants | Malaysia | 100.0 /100 | #43 | Exceptional $52,514 |
| Bulgarians | 100.0 /100 | #44 | Exceptional $52,512 |
| Immigrants | Czechoslovakia | 100.0 /100 | #45 | Exceptional $52,361 |
| Bhutanese | 100.0 /100 | #46 | Exceptional $52,297 |
| Australians | 100.0 /100 | #47 | Exceptional $52,294 |
| Immigrants | Europe | 100.0 /100 | #48 | Exceptional $52,195 |
| Bolivians | 100.0 /100 | #49 | Exceptional $52,005 |
| Immigrants | South Africa | 100.0 /100 | #50 | Exceptional $51,850 |
| Immigrants | Austria | 99.9 /100 | #51 | Exceptional $51,826 |
| Estonians | 99.9 /100 | #52 | Exceptional $51,772 |
| Immigrants | Norway | 99.9 /100 | #53 | Exceptional $51,758 |
| Immigrants | Indonesia | 99.9 /100 | #54 | Exceptional $51,715 |