Trinidadian and Tobagonian vs Swedish Median Earnings
COMPARE
Trinidadian and Tobagonian
Swedish
Median Earnings
Median Earnings Comparison
Trinidadians and Tobagonians
Swedes
$45,820
MEDIAN EARNINGS
29.7/ 100
METRIC RATING
198th/ 347
METRIC RANK
$47,851
MEDIAN EARNINGS
88.0/ 100
METRIC RATING
143rd/ 347
METRIC RANK
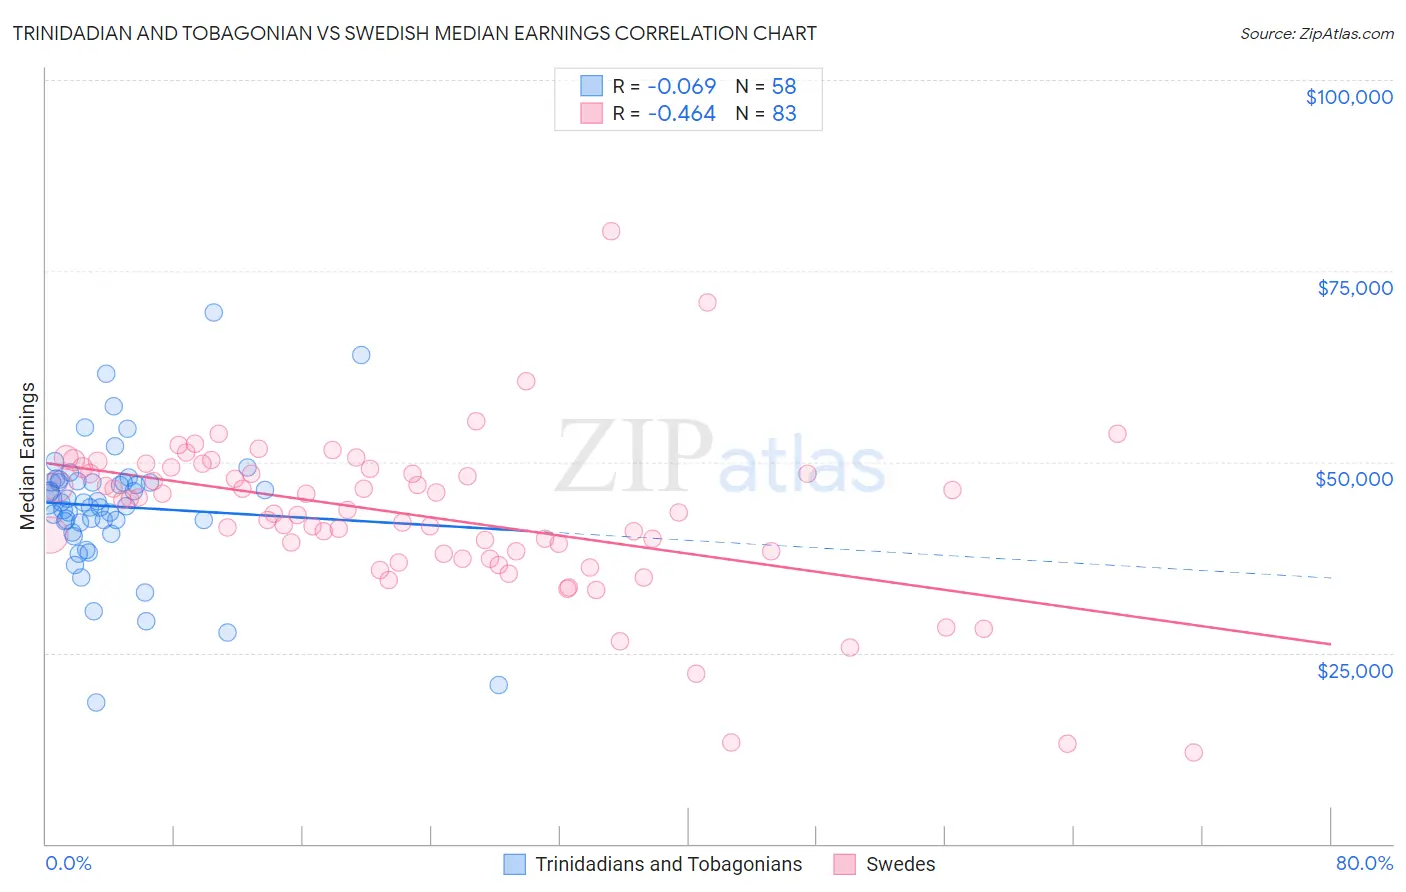
Trinidadian and Tobagonian vs Swedish Median Earnings Correlation Chart
The statistical analysis conducted on geographies consisting of 219,864,725 people shows a slight negative correlation between the proportion of Trinidadians and Tobagonians and median earnings in the United States with a correlation coefficient (R) of -0.069 and weighted average of $45,820. Similarly, the statistical analysis conducted on geographies consisting of 538,996,314 people shows a moderate negative correlation between the proportion of Swedes and median earnings in the United States with a correlation coefficient (R) of -0.464 and weighted average of $47,851, a difference of 4.4%.
Median Earnings Correlation Summary
| Measurement | Trinidadian and Tobagonian | Swedish |
| Minimum | $18,432 | $11,875 |
| Maximum | $69,500 | $80,254 |
| Range | $51,068 | $68,379 |
| Mean | $44,150 | $42,935 |
| Median | $44,668 | $43,757 |
| Interquartile 25% (IQ1) | $42,022 | $37,994 |
| Interquartile 75% (IQ3) | $47,373 | $49,030 |
| Interquartile Range (IQR) | $5,351 | $11,035 |
| Standard Deviation (Sample) | $8,720 | $10,532 |
| Standard Deviation (Population) | $8,644 | $10,468 |
Similar Demographics by Median Earnings
Demographics Similar to Trinidadians and Tobagonians by Median Earnings
In terms of median earnings, the demographic groups most similar to Trinidadians and Tobagonians are Immigrants from Barbados ($45,816, a difference of 0.010%), Immigrants from the Azores ($45,812, a difference of 0.020%), Yugoslavian ($45,846, a difference of 0.060%), Barbadian ($45,846, a difference of 0.060%), and Immigrants from St. Vincent and the Grenadines ($45,908, a difference of 0.19%).
| Demographics | Rating | Rank | Median Earnings |
| Finns | 33.4 /100 | #191 | Fair $45,940 |
| Germans | 33.2 /100 | #192 | Fair $45,935 |
| Guamanians/Chamorros | 33.2 /100 | #193 | Fair $45,933 |
| Immigrants | Costa Rica | 33.0 /100 | #194 | Fair $45,928 |
| Immigrants | St. Vincent and the Grenadines | 32.4 /100 | #195 | Fair $45,908 |
| Yugoslavians | 30.5 /100 | #196 | Fair $45,846 |
| Barbadians | 30.5 /100 | #197 | Fair $45,846 |
| Trinidadians and Tobagonians | 29.7 /100 | #198 | Fair $45,820 |
| Immigrants | Barbados | 29.6 /100 | #199 | Fair $45,816 |
| Immigrants | Azores | 29.5 /100 | #200 | Fair $45,812 |
| Celtics | 27.2 /100 | #201 | Fair $45,732 |
| Immigrants | Trinidad and Tobago | 27.1 /100 | #202 | Fair $45,729 |
| Welsh | 26.6 /100 | #203 | Fair $45,710 |
| Immigrants | Uruguay | 25.9 /100 | #204 | Fair $45,682 |
| Tongans | 25.4 /100 | #205 | Fair $45,665 |
Demographics Similar to Swedes by Median Earnings
In terms of median earnings, the demographic groups most similar to Swedes are Ugandan ($47,854, a difference of 0.010%), Immigrants from Sierra Leone ($47,875, a difference of 0.050%), Taiwanese ($47,902, a difference of 0.11%), Hungarian ($47,795, a difference of 0.12%), and European ($47,915, a difference of 0.13%).
| Demographics | Rating | Rank | Median Earnings |
| Slovenes | 90.0 /100 | #136 | Excellent $47,995 |
| Immigrants | Nepal | 89.0 /100 | #137 | Excellent $47,925 |
| Europeans | 88.9 /100 | #138 | Excellent $47,915 |
| Canadians | 88.8 /100 | #139 | Excellent $47,911 |
| Taiwanese | 88.7 /100 | #140 | Excellent $47,902 |
| Immigrants | Sierra Leone | 88.3 /100 | #141 | Excellent $47,875 |
| Ugandans | 88.0 /100 | #142 | Excellent $47,854 |
| Swedes | 88.0 /100 | #143 | Excellent $47,851 |
| Hungarians | 87.1 /100 | #144 | Excellent $47,795 |
| Immigrants | Saudi Arabia | 85.6 /100 | #145 | Excellent $47,704 |
| Immigrants | Chile | 85.5 /100 | #146 | Excellent $47,697 |
| Immigrants | South Eastern Asia | 85.0 /100 | #147 | Excellent $47,671 |
| Immigrants | Eritrea | 84.8 /100 | #148 | Excellent $47,657 |
| Luxembourgers | 84.5 /100 | #149 | Excellent $47,640 |
| Peruvians | 84.2 /100 | #150 | Excellent $47,628 |