Trinidadian and Tobagonian vs Australian Unemployment Among Ages 45 to 54 years
COMPARE
Trinidadian and Tobagonian
Australian
Unemployment Among Ages 45 to 54 years
Unemployment Among Ages 45 to 54 years Comparison
Trinidadians and Tobagonians
Australians
5.2%
UNEMPLOYMENT AMONG AGES 45 TO 54 YEARS
0.0/ 100
METRIC RATING
292nd/ 347
METRIC RANK
4.3%
UNEMPLOYMENT AMONG AGES 45 TO 54 YEARS
97.4/ 100
METRIC RATING
83rd/ 347
METRIC RANK
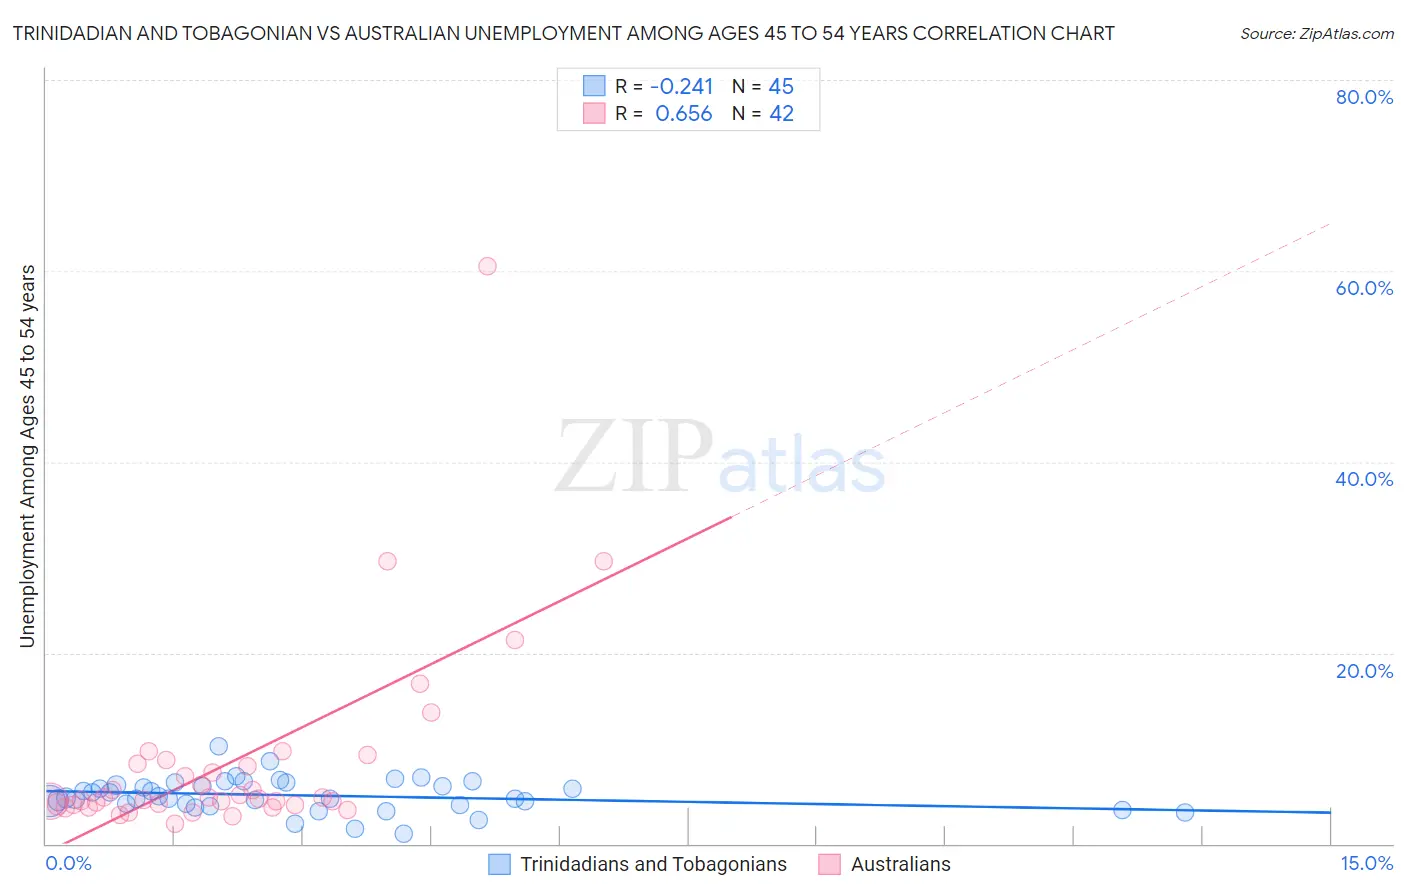
Trinidadian and Tobagonian vs Australian Unemployment Among Ages 45 to 54 years Correlation Chart
The statistical analysis conducted on geographies consisting of 216,980,624 people shows a weak negative correlation between the proportion of Trinidadians and Tobagonians and unemployment rate among population between the ages 45 and 54 in the United States with a correlation coefficient (R) of -0.241 and weighted average of 5.2%. Similarly, the statistical analysis conducted on geographies consisting of 220,525,115 people shows a significant positive correlation between the proportion of Australians and unemployment rate among population between the ages 45 and 54 in the United States with a correlation coefficient (R) of 0.656 and weighted average of 4.3%, a difference of 20.5%.
Unemployment Among Ages 45 to 54 years Correlation Summary
| Measurement | Trinidadian and Tobagonian | Australian |
| Minimum | 1.1% | 2.1% |
| Maximum | 10.2% | 60.5% |
| Range | 9.1% | 58.4% |
| Mean | 5.1% | 8.5% |
| Median | 4.8% | 4.8% |
| Interquartile 25% (IQ1) | 4.1% | 4.1% |
| Interquartile 75% (IQ3) | 6.2% | 8.4% |
| Interquartile Range (IQR) | 2.1% | 4.3% |
| Standard Deviation (Sample) | 1.7% | 10.4% |
| Standard Deviation (Population) | 1.7% | 10.2% |
Similar Demographics by Unemployment Among Ages 45 to 54 years
Demographics Similar to Trinidadians and Tobagonians by Unemployment Among Ages 45 to 54 years
In terms of unemployment among ages 45 to 54 years, the demographic groups most similar to Trinidadians and Tobagonians are Immigrants from Senegal (5.2%, a difference of 0.010%), Immigrants from Portugal (5.2%, a difference of 0.24%), Armenian (5.2%, a difference of 0.24%), Immigrants from Haiti (5.2%, a difference of 0.40%), and Belizean (5.2%, a difference of 0.59%).
| Demographics | Rating | Rank | Unemployment Among Ages 45 to 54 years |
| Iroquois | 0.0 /100 | #285 | Tragic 5.1% |
| Senegalese | 0.0 /100 | #286 | Tragic 5.1% |
| Haitians | 0.0 /100 | #287 | Tragic 5.2% |
| Immigrants | Caribbean | 0.0 /100 | #288 | Tragic 5.2% |
| Immigrants | Haiti | 0.0 /100 | #289 | Tragic 5.2% |
| Immigrants | Portugal | 0.0 /100 | #290 | Tragic 5.2% |
| Armenians | 0.0 /100 | #291 | Tragic 5.2% |
| Trinidadians and Tobagonians | 0.0 /100 | #292 | Tragic 5.2% |
| Immigrants | Senegal | 0.0 /100 | #293 | Tragic 5.2% |
| Belizeans | 0.0 /100 | #294 | Tragic 5.2% |
| Jamaicans | 0.0 /100 | #295 | Tragic 5.3% |
| Aleuts | 0.0 /100 | #296 | Tragic 5.3% |
| West Indians | 0.0 /100 | #297 | Tragic 5.3% |
| Immigrants | Trinidad and Tobago | 0.0 /100 | #298 | Tragic 5.3% |
| Ecuadorians | 0.0 /100 | #299 | Tragic 5.3% |
Demographics Similar to Australians by Unemployment Among Ages 45 to 54 years
In terms of unemployment among ages 45 to 54 years, the demographic groups most similar to Australians are Italian (4.3%, a difference of 0.040%), French (4.3%, a difference of 0.040%), Eastern European (4.3%, a difference of 0.080%), Ethiopian (4.3%, a difference of 0.080%), and Immigrants from Micronesia (4.3%, a difference of 0.11%).
| Demographics | Rating | Rank | Unemployment Among Ages 45 to 54 years |
| Slavs | 98.1 /100 | #76 | Exceptional 4.3% |
| Chileans | 98.1 /100 | #77 | Exceptional 4.3% |
| German Russians | 97.9 /100 | #78 | Exceptional 4.3% |
| Serbians | 97.9 /100 | #79 | Exceptional 4.3% |
| Cambodians | 97.8 /100 | #80 | Exceptional 4.3% |
| Immigrants | Micronesia | 97.6 /100 | #81 | Exceptional 4.3% |
| Eastern Europeans | 97.6 /100 | #82 | Exceptional 4.3% |
| Australians | 97.4 /100 | #83 | Exceptional 4.3% |
| Italians | 97.3 /100 | #84 | Exceptional 4.3% |
| French | 97.3 /100 | #85 | Exceptional 4.3% |
| Ethiopians | 97.2 /100 | #86 | Exceptional 4.3% |
| Sudanese | 97.0 /100 | #87 | Exceptional 4.3% |
| Immigrants | Turkey | 96.9 /100 | #88 | Exceptional 4.3% |
| Immigrants | Argentina | 96.9 /100 | #89 | Exceptional 4.3% |
| Asians | 96.8 /100 | #90 | Exceptional 4.3% |