Trinidadian and Tobagonian vs Liberian Median Earnings
COMPARE
Trinidadian and Tobagonian
Liberian
Median Earnings
Median Earnings Comparison
Trinidadians and Tobagonians
Liberians
$45,820
MEDIAN EARNINGS
29.7/ 100
METRIC RATING
198th/ 347
METRIC RANK
$43,536
MEDIAN EARNINGS
1.7/ 100
METRIC RATING
254th/ 347
METRIC RANK
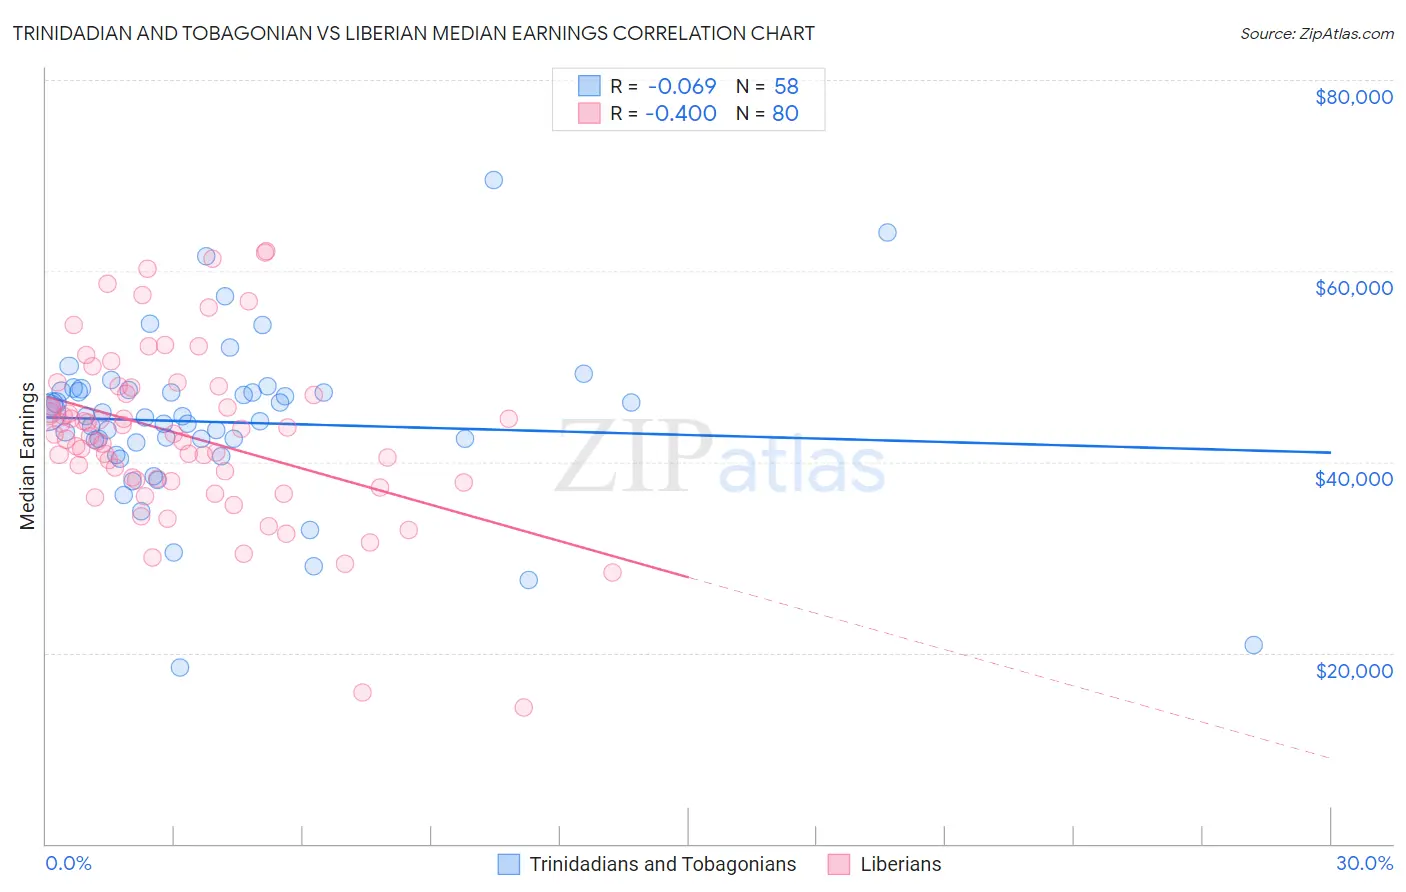
Trinidadian and Tobagonian vs Liberian Median Earnings Correlation Chart
The statistical analysis conducted on geographies consisting of 219,864,725 people shows a slight negative correlation between the proportion of Trinidadians and Tobagonians and median earnings in the United States with a correlation coefficient (R) of -0.069 and weighted average of $45,820. Similarly, the statistical analysis conducted on geographies consisting of 118,107,140 people shows a mild negative correlation between the proportion of Liberians and median earnings in the United States with a correlation coefficient (R) of -0.400 and weighted average of $43,536, a difference of 5.2%.
Median Earnings Correlation Summary
| Measurement | Trinidadian and Tobagonian | Liberian |
| Minimum | $18,432 | $14,336 |
| Maximum | $69,500 | $62,030 |
| Range | $51,068 | $47,694 |
| Mean | $44,150 | $42,795 |
| Median | $44,668 | $42,751 |
| Interquartile 25% (IQ1) | $42,022 | $38,041 |
| Interquartile 75% (IQ3) | $47,373 | $47,442 |
| Interquartile Range (IQR) | $5,351 | $9,402 |
| Standard Deviation (Sample) | $8,720 | $8,910 |
| Standard Deviation (Population) | $8,644 | $8,855 |
Similar Demographics by Median Earnings
Demographics Similar to Trinidadians and Tobagonians by Median Earnings
In terms of median earnings, the demographic groups most similar to Trinidadians and Tobagonians are Immigrants from Barbados ($45,816, a difference of 0.010%), Immigrants from the Azores ($45,812, a difference of 0.020%), Yugoslavian ($45,846, a difference of 0.060%), Barbadian ($45,846, a difference of 0.060%), and Immigrants from St. Vincent and the Grenadines ($45,908, a difference of 0.19%).
| Demographics | Rating | Rank | Median Earnings |
| Finns | 33.4 /100 | #191 | Fair $45,940 |
| Germans | 33.2 /100 | #192 | Fair $45,935 |
| Guamanians/Chamorros | 33.2 /100 | #193 | Fair $45,933 |
| Immigrants | Costa Rica | 33.0 /100 | #194 | Fair $45,928 |
| Immigrants | St. Vincent and the Grenadines | 32.4 /100 | #195 | Fair $45,908 |
| Yugoslavians | 30.5 /100 | #196 | Fair $45,846 |
| Barbadians | 30.5 /100 | #197 | Fair $45,846 |
| Trinidadians and Tobagonians | 29.7 /100 | #198 | Fair $45,820 |
| Immigrants | Barbados | 29.6 /100 | #199 | Fair $45,816 |
| Immigrants | Azores | 29.5 /100 | #200 | Fair $45,812 |
| Celtics | 27.2 /100 | #201 | Fair $45,732 |
| Immigrants | Trinidad and Tobago | 27.1 /100 | #202 | Fair $45,729 |
| Welsh | 26.6 /100 | #203 | Fair $45,710 |
| Immigrants | Uruguay | 25.9 /100 | #204 | Fair $45,682 |
| Tongans | 25.4 /100 | #205 | Fair $45,665 |
Demographics Similar to Liberians by Median Earnings
In terms of median earnings, the demographic groups most similar to Liberians are Somali ($43,567, a difference of 0.070%), Immigrants from Middle Africa ($43,416, a difference of 0.28%), Hawaiian ($43,673, a difference of 0.31%), Alaskan Athabascan ($43,393, a difference of 0.33%), and Tsimshian ($43,695, a difference of 0.37%).
| Demographics | Rating | Rank | Median Earnings |
| Immigrants | Cabo Verde | 3.0 /100 | #247 | Tragic $43,963 |
| Nepalese | 2.6 /100 | #248 | Tragic $43,860 |
| Malaysians | 2.6 /100 | #249 | Tragic $43,844 |
| Alaska Natives | 2.3 /100 | #250 | Tragic $43,750 |
| Tsimshian | 2.1 /100 | #251 | Tragic $43,695 |
| Hawaiians | 2.0 /100 | #252 | Tragic $43,673 |
| Somalis | 1.8 /100 | #253 | Tragic $43,567 |
| Liberians | 1.7 /100 | #254 | Tragic $43,536 |
| Immigrants | Middle Africa | 1.4 /100 | #255 | Tragic $43,416 |
| Alaskan Athabascans | 1.4 /100 | #256 | Tragic $43,393 |
| Jamaicans | 1.3 /100 | #257 | Tragic $43,343 |
| French American Indians | 1.3 /100 | #258 | Tragic $43,333 |
| German Russians | 1.1 /100 | #259 | Tragic $43,200 |
| Immigrants | Somalia | 0.9 /100 | #260 | Tragic $43,100 |
| Immigrants | Jamaica | 0.8 /100 | #261 | Tragic $43,026 |