Trinidadian and Tobagonian vs Immigrants from Italy Median Earnings
COMPARE
Trinidadian and Tobagonian
Immigrants from Italy
Median Earnings
Median Earnings Comparison
Trinidadians and Tobagonians
Immigrants from Italy
$45,820
MEDIAN EARNINGS
29.7/ 100
METRIC RATING
198th/ 347
METRIC RANK
$50,581
MEDIAN EARNINGS
99.7/ 100
METRIC RATING
76th/ 347
METRIC RANK
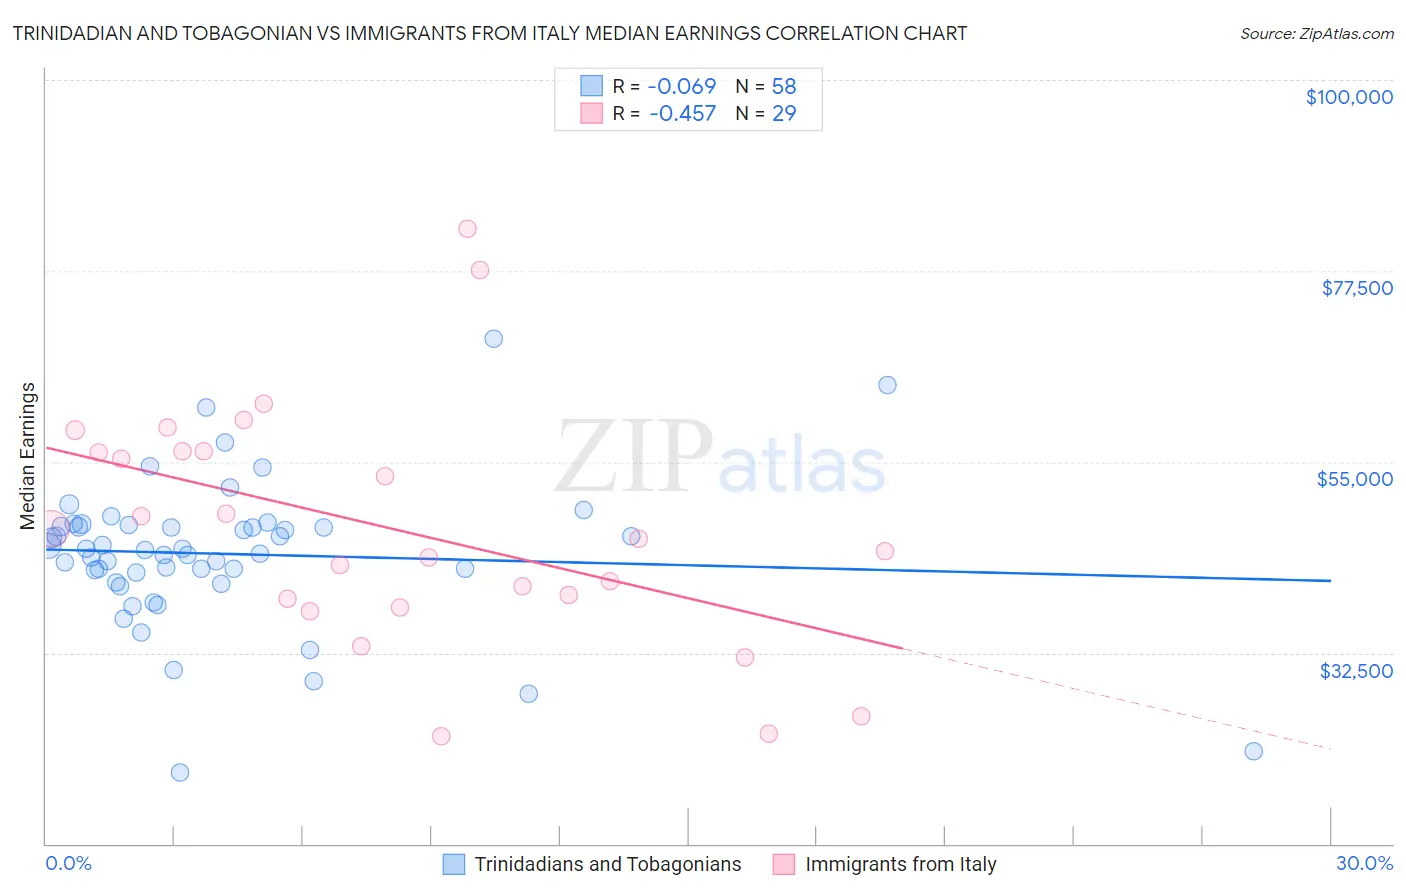
Trinidadian and Tobagonian vs Immigrants from Italy Median Earnings Correlation Chart
The statistical analysis conducted on geographies consisting of 219,864,725 people shows a slight negative correlation between the proportion of Trinidadians and Tobagonians and median earnings in the United States with a correlation coefficient (R) of -0.069 and weighted average of $45,820. Similarly, the statistical analysis conducted on geographies consisting of 324,208,754 people shows a moderate negative correlation between the proportion of Immigrants from Italy and median earnings in the United States with a correlation coefficient (R) of -0.457 and weighted average of $50,581, a difference of 10.4%.
Median Earnings Correlation Summary
| Measurement | Trinidadian and Tobagonian | Immigrants from Italy |
| Minimum | $18,432 | $22,656 |
| Maximum | $69,500 | $82,450 |
| Range | $51,068 | $59,794 |
| Mean | $44,150 | $47,205 |
| Median | $44,668 | $46,000 |
| Interquartile 25% (IQ1) | $42,022 | $38,371 |
| Interquartile 75% (IQ3) | $47,373 | $56,217 |
| Interquartile Range (IQR) | $5,351 | $17,846 |
| Standard Deviation (Sample) | $8,720 | $14,283 |
| Standard Deviation (Population) | $8,644 | $14,035 |
Similar Demographics by Median Earnings
Demographics Similar to Trinidadians and Tobagonians by Median Earnings
In terms of median earnings, the demographic groups most similar to Trinidadians and Tobagonians are Immigrants from Barbados ($45,816, a difference of 0.010%), Immigrants from the Azores ($45,812, a difference of 0.020%), Yugoslavian ($45,846, a difference of 0.060%), Barbadian ($45,846, a difference of 0.060%), and Immigrants from St. Vincent and the Grenadines ($45,908, a difference of 0.19%).
| Demographics | Rating | Rank | Median Earnings |
| Finns | 33.4 /100 | #191 | Fair $45,940 |
| Germans | 33.2 /100 | #192 | Fair $45,935 |
| Guamanians/Chamorros | 33.2 /100 | #193 | Fair $45,933 |
| Immigrants | Costa Rica | 33.0 /100 | #194 | Fair $45,928 |
| Immigrants | St. Vincent and the Grenadines | 32.4 /100 | #195 | Fair $45,908 |
| Yugoslavians | 30.5 /100 | #196 | Fair $45,846 |
| Barbadians | 30.5 /100 | #197 | Fair $45,846 |
| Trinidadians and Tobagonians | 29.7 /100 | #198 | Fair $45,820 |
| Immigrants | Barbados | 29.6 /100 | #199 | Fair $45,816 |
| Immigrants | Azores | 29.5 /100 | #200 | Fair $45,812 |
| Celtics | 27.2 /100 | #201 | Fair $45,732 |
| Immigrants | Trinidad and Tobago | 27.1 /100 | #202 | Fair $45,729 |
| Welsh | 26.6 /100 | #203 | Fair $45,710 |
| Immigrants | Uruguay | 25.9 /100 | #204 | Fair $45,682 |
| Tongans | 25.4 /100 | #205 | Fair $45,665 |
Demographics Similar to Immigrants from Italy by Median Earnings
In terms of median earnings, the demographic groups most similar to Immigrants from Italy are Immigrants from Western Europe ($50,549, a difference of 0.060%), Immigrants from Scotland ($50,741, a difference of 0.32%), South African ($50,752, a difference of 0.34%), Argentinean ($50,399, a difference of 0.36%), and Immigrants from Netherlands ($50,818, a difference of 0.47%).
| Demographics | Rating | Rank | Median Earnings |
| Mongolians | 99.8 /100 | #69 | Exceptional $51,038 |
| Lithuanians | 99.8 /100 | #70 | Exceptional $50,991 |
| Immigrants | Ukraine | 99.8 /100 | #71 | Exceptional $50,984 |
| Immigrants | Egypt | 99.8 /100 | #72 | Exceptional $50,901 |
| Immigrants | Netherlands | 99.8 /100 | #73 | Exceptional $50,818 |
| South Africans | 99.8 /100 | #74 | Exceptional $50,752 |
| Immigrants | Scotland | 99.8 /100 | #75 | Exceptional $50,741 |
| Immigrants | Italy | 99.7 /100 | #76 | Exceptional $50,581 |
| Immigrants | Western Europe | 99.7 /100 | #77 | Exceptional $50,549 |
| Argentineans | 99.6 /100 | #78 | Exceptional $50,399 |
| Laotians | 99.6 /100 | #79 | Exceptional $50,343 |
| Ukrainians | 99.6 /100 | #80 | Exceptional $50,320 |
| Immigrants | Southern Europe | 99.6 /100 | #81 | Exceptional $50,280 |
| Immigrants | Moldova | 99.5 /100 | #82 | Exceptional $50,274 |
| Romanians | 99.5 /100 | #83 | Exceptional $50,244 |