Trinidadian and Tobagonian vs Swiss Median Earnings
COMPARE
Trinidadian and Tobagonian
Swiss
Median Earnings
Median Earnings Comparison
Trinidadians and Tobagonians
Swiss
$45,820
MEDIAN EARNINGS
29.7/ 100
METRIC RATING
198th/ 347
METRIC RANK
$46,315
MEDIAN EARNINGS
45.9/ 100
METRIC RATING
182nd/ 347
METRIC RANK
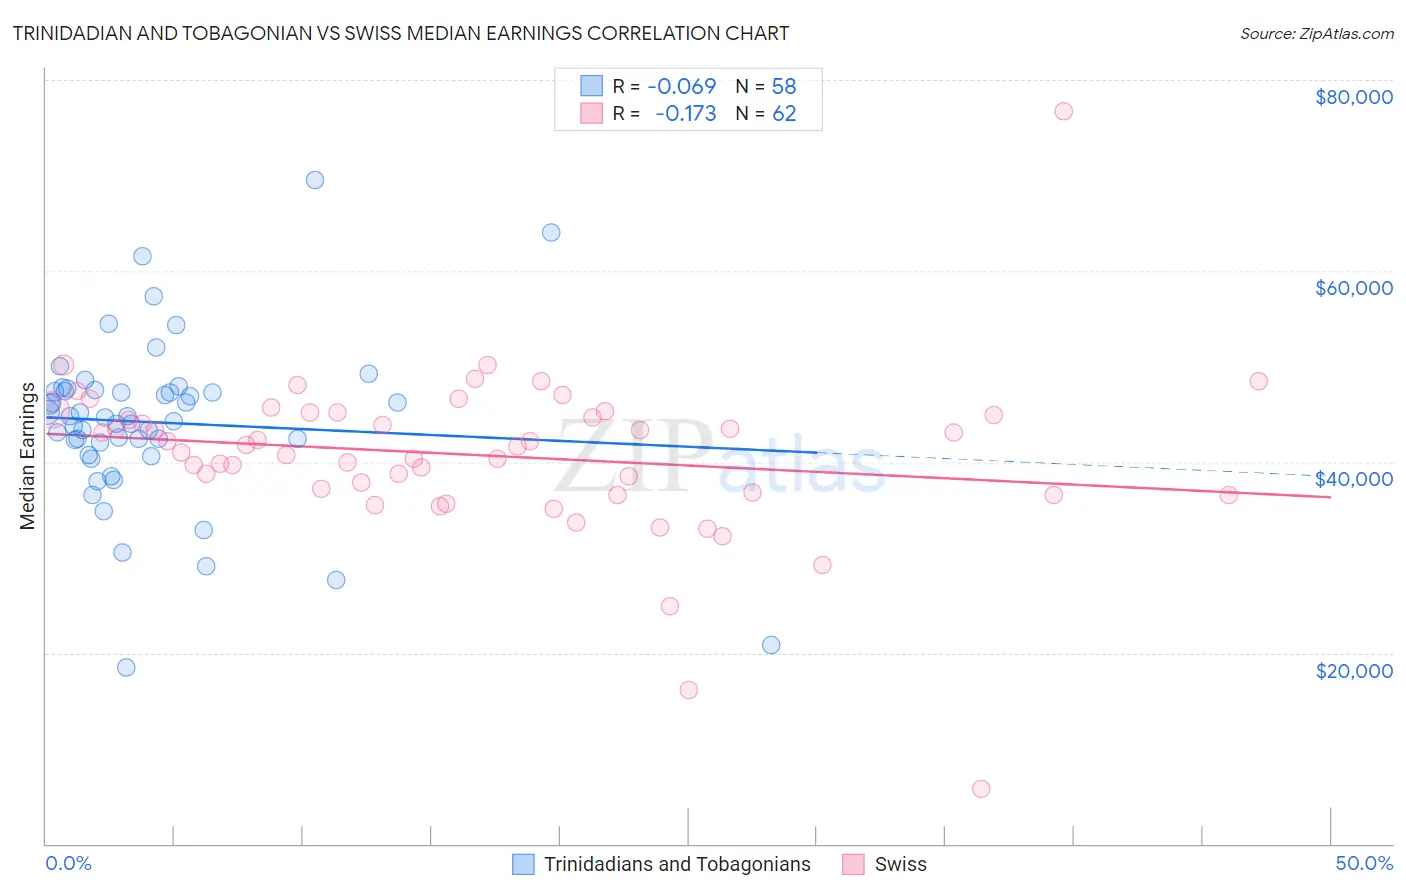
Trinidadian and Tobagonian vs Swiss Median Earnings Correlation Chart
The statistical analysis conducted on geographies consisting of 219,864,725 people shows a slight negative correlation between the proportion of Trinidadians and Tobagonians and median earnings in the United States with a correlation coefficient (R) of -0.069 and weighted average of $45,820. Similarly, the statistical analysis conducted on geographies consisting of 464,919,245 people shows a poor negative correlation between the proportion of Swiss and median earnings in the United States with a correlation coefficient (R) of -0.173 and weighted average of $46,315, a difference of 1.1%.
Median Earnings Correlation Summary
| Measurement | Trinidadian and Tobagonian | Swiss |
| Minimum | $18,432 | $5,729 |
| Maximum | $69,500 | $76,771 |
| Range | $51,068 | $71,042 |
| Mean | $44,150 | $40,710 |
| Median | $44,668 | $41,698 |
| Interquartile 25% (IQ1) | $42,022 | $36,797 |
| Interquartile 75% (IQ3) | $47,373 | $45,132 |
| Interquartile Range (IQR) | $5,351 | $8,335 |
| Standard Deviation (Sample) | $8,720 | $8,837 |
| Standard Deviation (Population) | $8,644 | $8,765 |
Demographics Similar to Trinidadians and Tobagonians and Swiss by Median Earnings
In terms of median earnings, the demographic groups most similar to Trinidadians and Tobagonians are Immigrants from Barbados ($45,816, a difference of 0.010%), Immigrants from the Azores ($45,812, a difference of 0.020%), Yugoslavian ($45,846, a difference of 0.060%), Barbadian ($45,846, a difference of 0.060%), and Immigrants from St. Vincent and the Grenadines ($45,908, a difference of 0.19%). Similarly, the demographic groups most similar to Swiss are Immigrants from Cameroon ($46,329, a difference of 0.030%), Puget Sound Salish ($46,333, a difference of 0.040%), French ($46,296, a difference of 0.040%), Immigrants from Kenya ($46,214, a difference of 0.22%), and Uruguayan ($46,190, a difference of 0.27%).
| Demographics | Rating | Rank | Median Earnings |
| Puget Sound Salish | 46.5 /100 | #180 | Average $46,333 |
| Immigrants | Cameroon | 46.4 /100 | #181 | Average $46,329 |
| Swiss | 45.9 /100 | #182 | Average $46,315 |
| French | 45.2 /100 | #183 | Average $46,296 |
| Immigrants | Kenya | 42.4 /100 | #184 | Average $46,214 |
| Uruguayans | 41.6 /100 | #185 | Average $46,190 |
| Vietnamese | 40.9 /100 | #186 | Average $46,172 |
| Iraqis | 39.9 /100 | #187 | Fair $46,140 |
| Immigrants | Armenia | 38.3 /100 | #188 | Fair $46,094 |
| Spaniards | 37.2 /100 | #189 | Fair $46,059 |
| French Canadians | 36.1 /100 | #190 | Fair $46,026 |
| Finns | 33.4 /100 | #191 | Fair $45,940 |
| Germans | 33.2 /100 | #192 | Fair $45,935 |
| Guamanians/Chamorros | 33.2 /100 | #193 | Fair $45,933 |
| Immigrants | Costa Rica | 33.0 /100 | #194 | Fair $45,928 |
| Immigrants | St. Vincent and the Grenadines | 32.4 /100 | #195 | Fair $45,908 |
| Yugoslavians | 30.5 /100 | #196 | Fair $45,846 |
| Barbadians | 30.5 /100 | #197 | Fair $45,846 |
| Trinidadians and Tobagonians | 29.7 /100 | #198 | Fair $45,820 |
| Immigrants | Barbados | 29.6 /100 | #199 | Fair $45,816 |
| Immigrants | Azores | 29.5 /100 | #200 | Fair $45,812 |