Tongan vs Immigrants from Liberia Per Capita Income
COMPARE
Tongan
Immigrants from Liberia
Per Capita Income
Per Capita Income Comparison
Tongans
Immigrants from Liberia
$41,693
PER CAPITA INCOME
9.9/ 100
METRIC RATING
216th/ 347
METRIC RANK
$38,165
PER CAPITA INCOME
0.2/ 100
METRIC RATING
275th/ 347
METRIC RANK
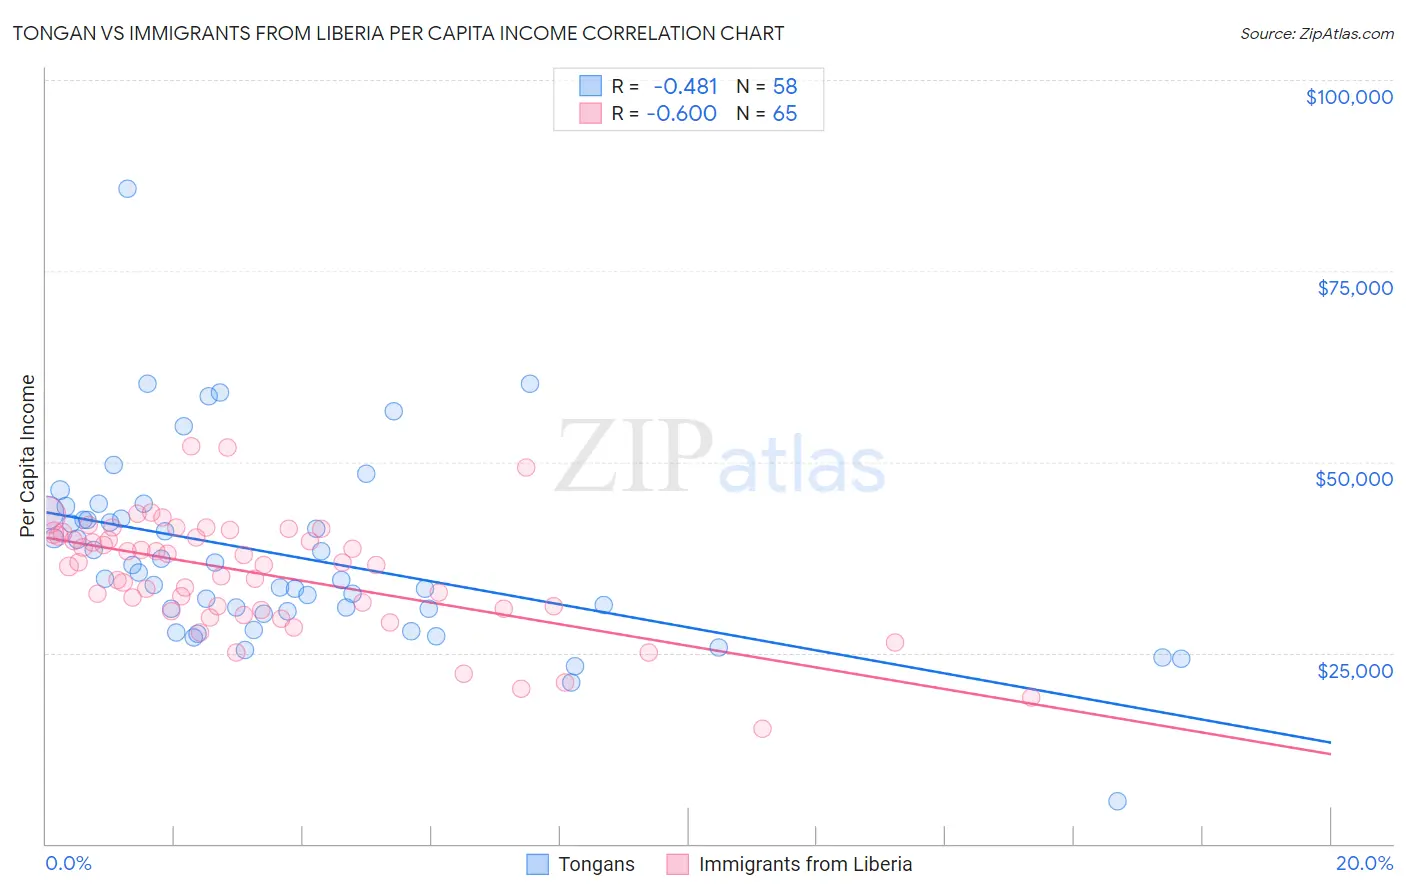
Tongan vs Immigrants from Liberia Per Capita Income Correlation Chart
The statistical analysis conducted on geographies consisting of 102,908,385 people shows a moderate negative correlation between the proportion of Tongans and per capita income in the United States with a correlation coefficient (R) of -0.481 and weighted average of $41,693. Similarly, the statistical analysis conducted on geographies consisting of 135,297,410 people shows a substantial negative correlation between the proportion of Immigrants from Liberia and per capita income in the United States with a correlation coefficient (R) of -0.600 and weighted average of $38,165, a difference of 9.2%.
Per Capita Income Correlation Summary
| Measurement | Tongan | Immigrants from Liberia |
| Minimum | $5,622 | $15,041 |
| Maximum | $85,704 | $52,065 |
| Range | $80,082 | $37,024 |
| Mean | $37,644 | $35,319 |
| Median | $35,100 | $36,534 |
| Interquartile 25% (IQ1) | $30,397 | $30,654 |
| Interquartile 75% (IQ3) | $42,507 | $40,514 |
| Interquartile Range (IQR) | $12,110 | $9,860 |
| Standard Deviation (Sample) | $12,429 | $7,386 |
| Standard Deviation (Population) | $12,321 | $7,329 |
Similar Demographics by Per Capita Income
Demographics Similar to Tongans by Per Capita Income
In terms of per capita income, the demographic groups most similar to Tongans are Sudanese ($41,695, a difference of 0.010%), Guamanian/Chamorro ($41,678, a difference of 0.030%), Immigrants from Bangladesh ($41,709, a difference of 0.040%), Immigrants from Venezuela ($41,727, a difference of 0.080%), and Trinidadian and Tobagonian ($41,655, a difference of 0.090%).
| Demographics | Rating | Rank | Per Capita Income |
| Immigrants | Sudan | 13.2 /100 | #209 | Poor $41,986 |
| Ecuadorians | 12.9 /100 | #210 | Poor $41,958 |
| Immigrants | Panama | 11.6 /100 | #211 | Poor $41,853 |
| Immigrants | Senegal | 11.3 /100 | #212 | Poor $41,830 |
| Immigrants | Venezuela | 10.2 /100 | #213 | Poor $41,727 |
| Immigrants | Bangladesh | 10.1 /100 | #214 | Poor $41,709 |
| Sudanese | 9.9 /100 | #215 | Tragic $41,695 |
| Tongans | 9.9 /100 | #216 | Tragic $41,693 |
| Guamanians/Chamorros | 9.7 /100 | #217 | Tragic $41,678 |
| Trinidadians and Tobagonians | 9.5 /100 | #218 | Tragic $41,655 |
| Puget Sound Salish | 8.1 /100 | #219 | Tragic $41,495 |
| Immigrants | Barbados | 7.9 /100 | #220 | Tragic $41,478 |
| Immigrants | Trinidad and Tobago | 7.9 /100 | #221 | Tragic $41,476 |
| Immigrants | Iraq | 7.1 /100 | #222 | Tragic $41,365 |
| Immigrants | Cameroon | 6.8 /100 | #223 | Tragic $41,334 |
Demographics Similar to Immigrants from Liberia by Per Capita Income
In terms of per capita income, the demographic groups most similar to Immigrants from Liberia are Hmong ($38,120, a difference of 0.12%), Comanche ($38,088, a difference of 0.20%), Immigrants from Nicaragua ($38,065, a difference of 0.26%), Colville ($38,047, a difference of 0.31%), and Potawatomi ($38,046, a difference of 0.31%).
| Demographics | Rating | Rank | Per Capita Income |
| Liberians | 0.4 /100 | #268 | Tragic $38,780 |
| Immigrants | Jamaica | 0.4 /100 | #269 | Tragic $38,766 |
| Immigrants | Belize | 0.3 /100 | #270 | Tragic $38,614 |
| Central Americans | 0.3 /100 | #271 | Tragic $38,560 |
| Immigrants | Cabo Verde | 0.3 /100 | #272 | Tragic $38,540 |
| Nepalese | 0.3 /100 | #273 | Tragic $38,442 |
| Immigrants | El Salvador | 0.3 /100 | #274 | Tragic $38,394 |
| Immigrants | Liberia | 0.2 /100 | #275 | Tragic $38,165 |
| Hmong | 0.2 /100 | #276 | Tragic $38,120 |
| Comanche | 0.2 /100 | #277 | Tragic $38,088 |
| Immigrants | Nicaragua | 0.2 /100 | #278 | Tragic $38,065 |
| Colville | 0.2 /100 | #279 | Tragic $38,047 |
| Potawatomi | 0.2 /100 | #280 | Tragic $38,046 |
| Immigrants | Dominica | 0.2 /100 | #281 | Tragic $37,952 |
| Immigrants | Laos | 0.1 /100 | #282 | Tragic $37,857 |