Immigrants from Guatemala vs Immigrants from Zimbabwe Per Capita Income
COMPARE
Immigrants from Guatemala
Immigrants from Zimbabwe
Per Capita Income
Per Capita Income Comparison
Immigrants from Guatemala
Immigrants from Zimbabwe
$37,550
PER CAPITA INCOME
0.1/ 100
METRIC RATING
290th/ 347
METRIC RANK
$47,394
PER CAPITA INCOME
98.5/ 100
METRIC RATING
93rd/ 347
METRIC RANK
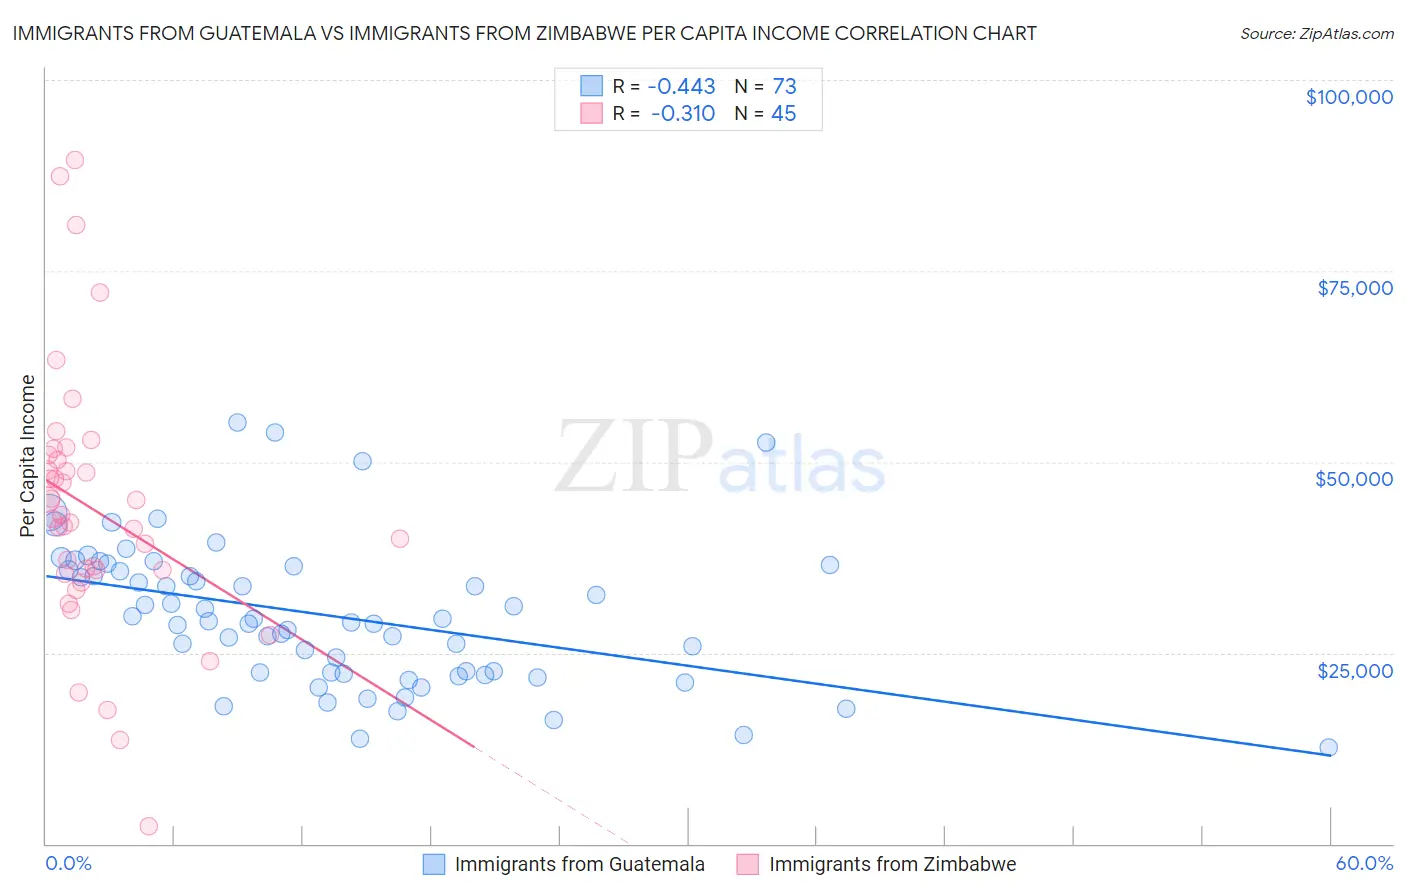
Immigrants from Guatemala vs Immigrants from Zimbabwe Per Capita Income Correlation Chart
The statistical analysis conducted on geographies consisting of 377,292,357 people shows a moderate negative correlation between the proportion of Immigrants from Guatemala and per capita income in the United States with a correlation coefficient (R) of -0.443 and weighted average of $37,550. Similarly, the statistical analysis conducted on geographies consisting of 117,813,757 people shows a mild negative correlation between the proportion of Immigrants from Zimbabwe and per capita income in the United States with a correlation coefficient (R) of -0.310 and weighted average of $47,394, a difference of 26.2%.
Per Capita Income Correlation Summary
| Measurement | Immigrants from Guatemala | Immigrants from Zimbabwe |
| Minimum | $12,606 | $2,302 |
| Maximum | $55,157 | $89,578 |
| Range | $42,551 | $87,276 |
| Mean | $29,919 | $43,763 |
| Median | $29,061 | $42,560 |
| Interquartile 25% (IQ1) | $22,369 | $35,574 |
| Interquartile 75% (IQ3) | $36,058 | $50,554 |
| Interquartile Range (IQR) | $13,690 | $14,981 |
| Standard Deviation (Sample) | $9,360 | $17,068 |
| Standard Deviation (Population) | $9,296 | $16,878 |
Similar Demographics by Per Capita Income
Demographics Similar to Immigrants from Guatemala by Per Capita Income
In terms of per capita income, the demographic groups most similar to Immigrants from Guatemala are Cajun ($37,527, a difference of 0.060%), U.S. Virgin Islander ($37,589, a difference of 0.10%), Immigrants from Micronesia ($37,464, a difference of 0.23%), Mexican American Indian ($37,407, a difference of 0.38%), and Dominican ($37,697, a difference of 0.39%).
| Demographics | Rating | Rank | Per Capita Income |
| Pennsylvania Germans | 0.1 /100 | #283 | Tragic $37,842 |
| Africans | 0.1 /100 | #284 | Tragic $37,785 |
| Guatemalans | 0.1 /100 | #285 | Tragic $37,766 |
| Central American Indians | 0.1 /100 | #286 | Tragic $37,699 |
| Dominicans | 0.1 /100 | #287 | Tragic $37,697 |
| Blackfeet | 0.1 /100 | #288 | Tragic $37,695 |
| U.S. Virgin Islanders | 0.1 /100 | #289 | Tragic $37,589 |
| Immigrants | Guatemala | 0.1 /100 | #290 | Tragic $37,550 |
| Cajuns | 0.1 /100 | #291 | Tragic $37,527 |
| Immigrants | Micronesia | 0.1 /100 | #292 | Tragic $37,464 |
| Mexican American Indians | 0.1 /100 | #293 | Tragic $37,407 |
| Cubans | 0.1 /100 | #294 | Tragic $37,383 |
| Immigrants | Dominican Republic | 0.1 /100 | #295 | Tragic $37,306 |
| Indonesians | 0.1 /100 | #296 | Tragic $37,300 |
| Haitians | 0.1 /100 | #297 | Tragic $37,289 |
Demographics Similar to Immigrants from Zimbabwe by Per Capita Income
In terms of per capita income, the demographic groups most similar to Immigrants from Zimbabwe are Albanian ($47,379, a difference of 0.030%), Immigrants from Egypt ($47,361, a difference of 0.070%), Immigrants from Moldova ($47,489, a difference of 0.20%), Alsatian ($47,284, a difference of 0.23%), and Carpatho Rusyn ($47,248, a difference of 0.31%).
| Demographics | Rating | Rank | Per Capita Income |
| Immigrants | Southern Europe | 99.3 /100 | #86 | Exceptional $48,027 |
| Ukrainians | 99.3 /100 | #87 | Exceptional $48,014 |
| Croatians | 99.0 /100 | #88 | Exceptional $47,742 |
| Northern Europeans | 98.9 /100 | #89 | Exceptional $47,698 |
| Italians | 98.8 /100 | #90 | Exceptional $47,574 |
| Macedonians | 98.8 /100 | #91 | Exceptional $47,573 |
| Immigrants | Moldova | 98.7 /100 | #92 | Exceptional $47,489 |
| Immigrants | Zimbabwe | 98.5 /100 | #93 | Exceptional $47,394 |
| Albanians | 98.5 /100 | #94 | Exceptional $47,379 |
| Immigrants | Egypt | 98.5 /100 | #95 | Exceptional $47,361 |
| Alsatians | 98.3 /100 | #96 | Exceptional $47,284 |
| Carpatho Rusyns | 98.2 /100 | #97 | Exceptional $47,248 |
| Immigrants | Pakistan | 97.9 /100 | #98 | Exceptional $47,084 |
| Laotians | 97.8 /100 | #99 | Exceptional $47,041 |
| Immigrants | Lebanon | 97.5 /100 | #100 | Exceptional $46,938 |