Tongan vs Finnish Per Capita Income
COMPARE
Tongan
Finnish
Per Capita Income
Per Capita Income Comparison
Tongans
Finns
$41,693
PER CAPITA INCOME
9.9/ 100
METRIC RATING
216th/ 347
METRIC RANK
$43,461
PER CAPITA INCOME
44.4/ 100
METRIC RATING
179th/ 347
METRIC RANK
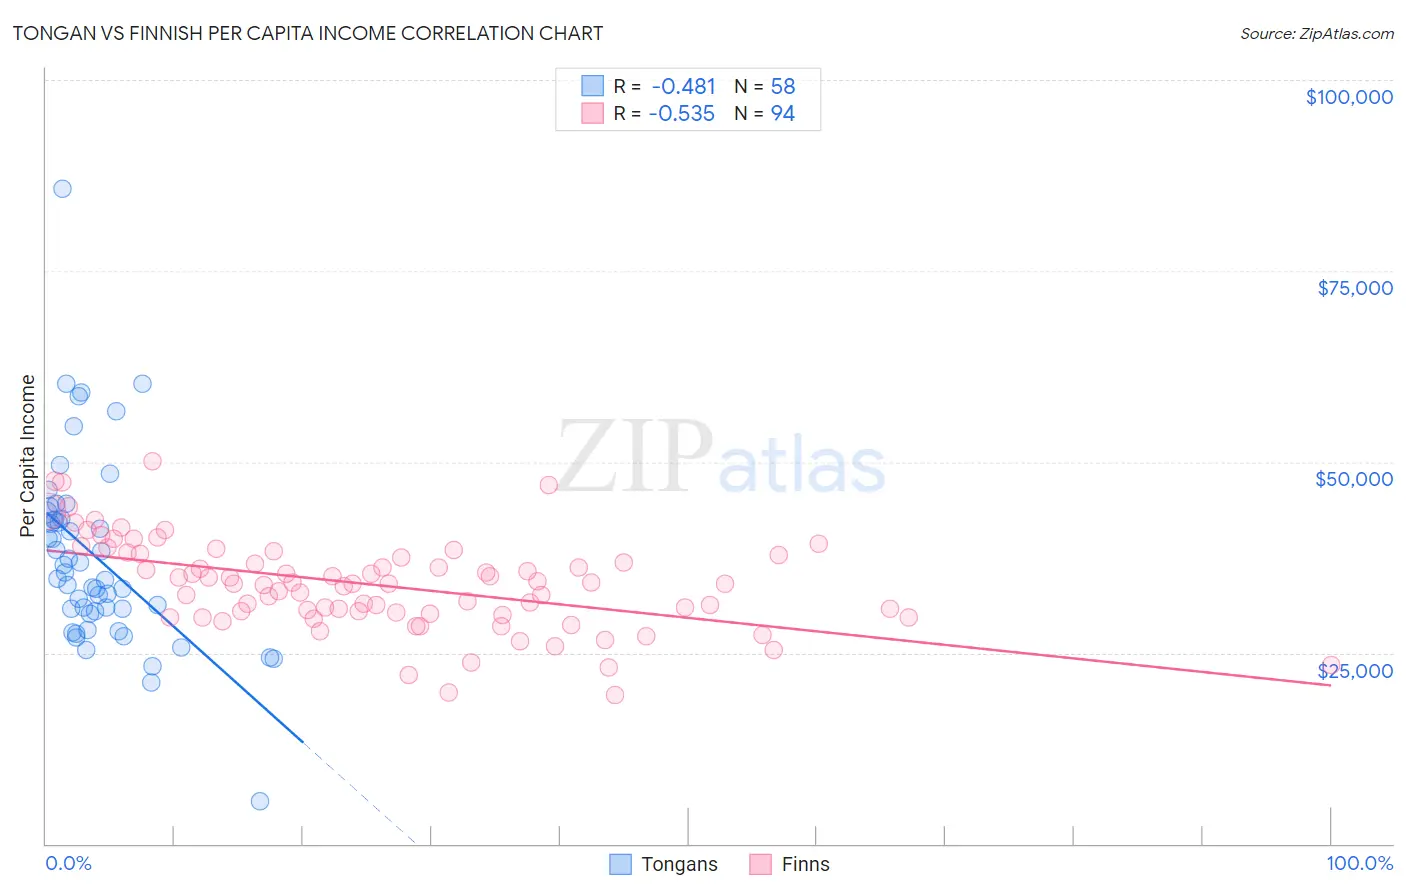
Tongan vs Finnish Per Capita Income Correlation Chart
The statistical analysis conducted on geographies consisting of 102,908,385 people shows a moderate negative correlation between the proportion of Tongans and per capita income in the United States with a correlation coefficient (R) of -0.481 and weighted average of $41,693. Similarly, the statistical analysis conducted on geographies consisting of 404,694,586 people shows a substantial negative correlation between the proportion of Finns and per capita income in the United States with a correlation coefficient (R) of -0.535 and weighted average of $43,461, a difference of 4.2%.
Per Capita Income Correlation Summary
| Measurement | Tongan | Finnish |
| Minimum | $5,622 | $19,546 |
| Maximum | $85,704 | $50,135 |
| Range | $80,082 | $30,589 |
| Mean | $37,644 | $33,846 |
| Median | $35,100 | $34,020 |
| Interquartile 25% (IQ1) | $30,397 | $30,059 |
| Interquartile 75% (IQ3) | $42,507 | $37,749 |
| Interquartile Range (IQR) | $12,110 | $7,690 |
| Standard Deviation (Sample) | $12,429 | $5,978 |
| Standard Deviation (Population) | $12,321 | $5,946 |
Similar Demographics by Per Capita Income
Demographics Similar to Tongans by Per Capita Income
In terms of per capita income, the demographic groups most similar to Tongans are Sudanese ($41,695, a difference of 0.010%), Guamanian/Chamorro ($41,678, a difference of 0.030%), Immigrants from Bangladesh ($41,709, a difference of 0.040%), Immigrants from Venezuela ($41,727, a difference of 0.080%), and Trinidadian and Tobagonian ($41,655, a difference of 0.090%).
| Demographics | Rating | Rank | Per Capita Income |
| Immigrants | Sudan | 13.2 /100 | #209 | Poor $41,986 |
| Ecuadorians | 12.9 /100 | #210 | Poor $41,958 |
| Immigrants | Panama | 11.6 /100 | #211 | Poor $41,853 |
| Immigrants | Senegal | 11.3 /100 | #212 | Poor $41,830 |
| Immigrants | Venezuela | 10.2 /100 | #213 | Poor $41,727 |
| Immigrants | Bangladesh | 10.1 /100 | #214 | Poor $41,709 |
| Sudanese | 9.9 /100 | #215 | Tragic $41,695 |
| Tongans | 9.9 /100 | #216 | Tragic $41,693 |
| Guamanians/Chamorros | 9.7 /100 | #217 | Tragic $41,678 |
| Trinidadians and Tobagonians | 9.5 /100 | #218 | Tragic $41,655 |
| Puget Sound Salish | 8.1 /100 | #219 | Tragic $41,495 |
| Immigrants | Barbados | 7.9 /100 | #220 | Tragic $41,478 |
| Immigrants | Trinidad and Tobago | 7.9 /100 | #221 | Tragic $41,476 |
| Immigrants | Iraq | 7.1 /100 | #222 | Tragic $41,365 |
| Immigrants | Cameroon | 6.8 /100 | #223 | Tragic $41,334 |
Demographics Similar to Finns by Per Capita Income
In terms of per capita income, the demographic groups most similar to Finns are Immigrants from Costa Rica ($43,464, a difference of 0.010%), Tlingit-Haida ($43,516, a difference of 0.13%), Sierra Leonean ($43,405, a difference of 0.13%), Immigrants from South Eastern Asia ($43,539, a difference of 0.18%), and Celtic ($43,621, a difference of 0.37%).
| Demographics | Rating | Rank | Per Capita Income |
| Czechoslovakians | 54.1 /100 | #172 | Average $43,806 |
| French | 50.7 /100 | #173 | Average $43,685 |
| Colombians | 50.0 /100 | #174 | Average $43,661 |
| Celtics | 48.9 /100 | #175 | Average $43,621 |
| Immigrants | South Eastern Asia | 46.6 /100 | #176 | Average $43,539 |
| Tlingit-Haida | 45.9 /100 | #177 | Average $43,516 |
| Immigrants | Costa Rica | 44.5 /100 | #178 | Average $43,464 |
| Finns | 44.4 /100 | #179 | Average $43,461 |
| Sierra Leoneans | 42.9 /100 | #180 | Average $43,405 |
| Welsh | 38.2 /100 | #181 | Fair $43,233 |
| Immigrants | Vietnam | 38.1 /100 | #182 | Fair $43,229 |
| Germans | 33.9 /100 | #183 | Fair $43,067 |
| Spaniards | 32.9 /100 | #184 | Fair $43,028 |
| Immigrants | Immigrants | 32.5 /100 | #185 | Fair $43,010 |
| French Canadians | 32.3 /100 | #186 | Fair $43,003 |