Tongan vs Scandinavian Per Capita Income
COMPARE
Tongan
Scandinavian
Per Capita Income
Per Capita Income Comparison
Tongans
Scandinavians
$41,693
PER CAPITA INCOME
9.9/ 100
METRIC RATING
216th/ 347
METRIC RANK
$43,848
PER CAPITA INCOME
55.2/ 100
METRIC RATING
170th/ 347
METRIC RANK
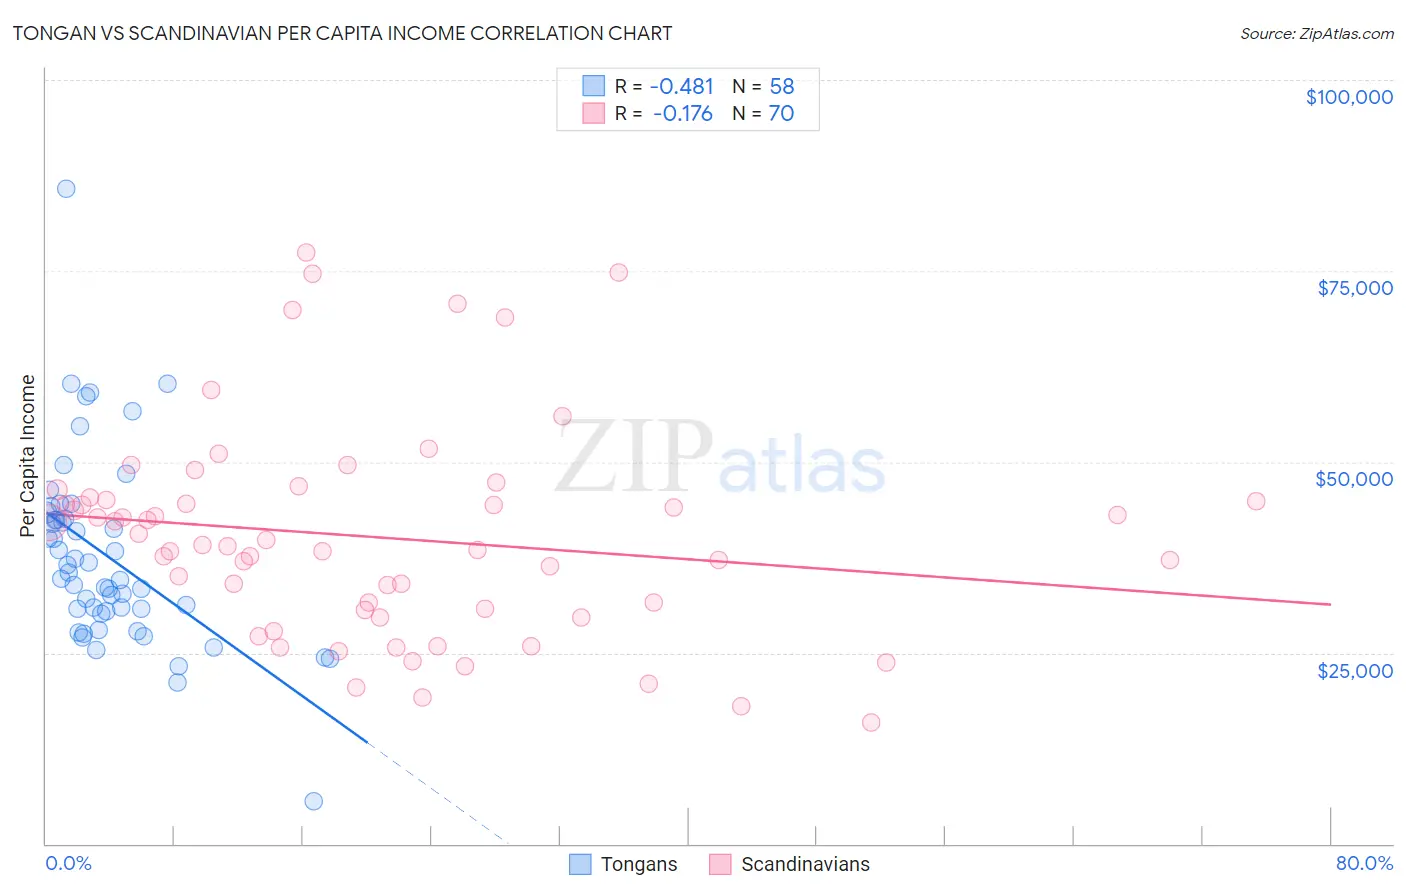
Tongan vs Scandinavian Per Capita Income Correlation Chart
The statistical analysis conducted on geographies consisting of 102,908,385 people shows a moderate negative correlation between the proportion of Tongans and per capita income in the United States with a correlation coefficient (R) of -0.481 and weighted average of $41,693. Similarly, the statistical analysis conducted on geographies consisting of 472,676,138 people shows a poor negative correlation between the proportion of Scandinavians and per capita income in the United States with a correlation coefficient (R) of -0.176 and weighted average of $43,848, a difference of 5.2%.
Per Capita Income Correlation Summary
| Measurement | Tongan | Scandinavian |
| Minimum | $5,622 | $15,911 |
| Maximum | $85,704 | $77,383 |
| Range | $80,082 | $61,472 |
| Mean | $37,644 | $40,106 |
| Median | $35,100 | $39,048 |
| Interquartile 25% (IQ1) | $30,397 | $30,666 |
| Interquartile 75% (IQ3) | $42,507 | $45,055 |
| Interquartile Range (IQR) | $12,110 | $14,389 |
| Standard Deviation (Sample) | $12,429 | $13,782 |
| Standard Deviation (Population) | $12,321 | $13,683 |
Similar Demographics by Per Capita Income
Demographics Similar to Tongans by Per Capita Income
In terms of per capita income, the demographic groups most similar to Tongans are Sudanese ($41,695, a difference of 0.010%), Guamanian/Chamorro ($41,678, a difference of 0.030%), Immigrants from Bangladesh ($41,709, a difference of 0.040%), Immigrants from Venezuela ($41,727, a difference of 0.080%), and Trinidadian and Tobagonian ($41,655, a difference of 0.090%).
| Demographics | Rating | Rank | Per Capita Income |
| Immigrants | Sudan | 13.2 /100 | #209 | Poor $41,986 |
| Ecuadorians | 12.9 /100 | #210 | Poor $41,958 |
| Immigrants | Panama | 11.6 /100 | #211 | Poor $41,853 |
| Immigrants | Senegal | 11.3 /100 | #212 | Poor $41,830 |
| Immigrants | Venezuela | 10.2 /100 | #213 | Poor $41,727 |
| Immigrants | Bangladesh | 10.1 /100 | #214 | Poor $41,709 |
| Sudanese | 9.9 /100 | #215 | Tragic $41,695 |
| Tongans | 9.9 /100 | #216 | Tragic $41,693 |
| Guamanians/Chamorros | 9.7 /100 | #217 | Tragic $41,678 |
| Trinidadians and Tobagonians | 9.5 /100 | #218 | Tragic $41,655 |
| Puget Sound Salish | 8.1 /100 | #219 | Tragic $41,495 |
| Immigrants | Barbados | 7.9 /100 | #220 | Tragic $41,478 |
| Immigrants | Trinidad and Tobago | 7.9 /100 | #221 | Tragic $41,476 |
| Immigrants | Iraq | 7.1 /100 | #222 | Tragic $41,365 |
| Immigrants | Cameroon | 6.8 /100 | #223 | Tragic $41,334 |
Demographics Similar to Scandinavians by Per Capita Income
In terms of per capita income, the demographic groups most similar to Scandinavians are Immigrants from Peru ($43,852, a difference of 0.010%), Immigrants from Eastern Africa ($43,838, a difference of 0.020%), Czechoslovakian ($43,806, a difference of 0.090%), Belgian ($43,951, a difference of 0.24%), and English ($43,982, a difference of 0.31%).
| Demographics | Rating | Rank | Per Capita Income |
| Immigrants | South America | 61.2 /100 | #163 | Good $44,068 |
| Sri Lankans | 59.8 /100 | #164 | Average $44,014 |
| Immigrants | Philippines | 59.4 /100 | #165 | Average $44,000 |
| Immigrants | Uruguay | 59.3 /100 | #166 | Average $43,997 |
| English | 58.9 /100 | #167 | Average $43,982 |
| Belgians | 58.1 /100 | #168 | Average $43,951 |
| Immigrants | Peru | 55.3 /100 | #169 | Average $43,852 |
| Scandinavians | 55.2 /100 | #170 | Average $43,848 |
| Immigrants | Eastern Africa | 54.9 /100 | #171 | Average $43,838 |
| Czechoslovakians | 54.1 /100 | #172 | Average $43,806 |
| French | 50.7 /100 | #173 | Average $43,685 |
| Colombians | 50.0 /100 | #174 | Average $43,661 |
| Celtics | 48.9 /100 | #175 | Average $43,621 |
| Immigrants | South Eastern Asia | 46.6 /100 | #176 | Average $43,539 |
| Tlingit-Haida | 45.9 /100 | #177 | Average $43,516 |