Tohono O'odham vs Thai Householder Income Over 65 years
COMPARE
Tohono O'odham
Thai
Householder Income Over 65 years
Householder Income Over 65 years Comparison
Tohono O'odham
Thais
$49,121
HOUSEHOLDER INCOME OVER 65 YEARS
0.0/ 100
METRIC RATING
337th/ 347
METRIC RANK
$72,099
HOUSEHOLDER INCOME OVER 65 YEARS
100.0/ 100
METRIC RATING
11th/ 347
METRIC RANK
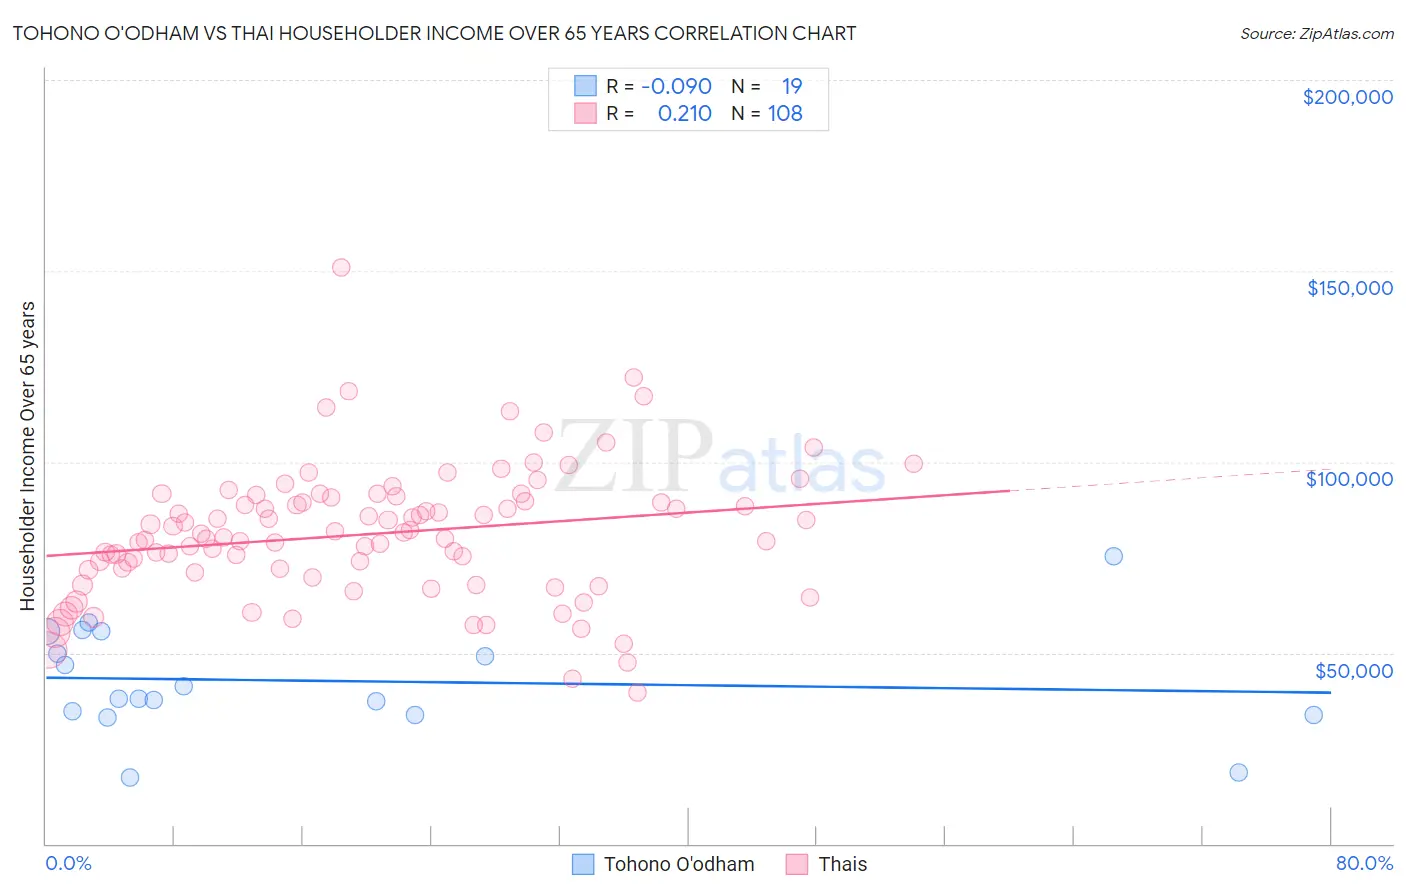
Tohono O'odham vs Thai Householder Income Over 65 years Correlation Chart
The statistical analysis conducted on geographies consisting of 58,613,194 people shows a slight negative correlation between the proportion of Tohono O'odham and household income with householder over the age of 65 in the United States with a correlation coefficient (R) of -0.090 and weighted average of $49,121. Similarly, the statistical analysis conducted on geographies consisting of 473,553,287 people shows a weak positive correlation between the proportion of Thais and household income with householder over the age of 65 in the United States with a correlation coefficient (R) of 0.210 and weighted average of $72,099, a difference of 46.8%.
Householder Income Over 65 years Correlation Summary
| Measurement | Tohono O'odham | Thai |
| Minimum | $17,500 | $39,750 |
| Maximum | $75,324 | $150,903 |
| Range | $57,824 | $111,153 |
| Mean | $42,619 | $81,057 |
| Median | $38,125 | $80,676 |
| Interquartile 25% (IQ1) | $33,875 | $71,396 |
| Interquartile 75% (IQ3) | $55,494 | $90,161 |
| Interquartile Range (IQR) | $21,619 | $18,766 |
| Standard Deviation (Sample) | $14,019 | $17,305 |
| Standard Deviation (Population) | $13,645 | $17,224 |
Similar Demographics by Householder Income Over 65 years
Demographics Similar to Tohono O'odham by Householder Income Over 65 years
In terms of householder income over 65 years, the demographic groups most similar to Tohono O'odham are Cuban ($49,152, a difference of 0.060%), Crow ($49,234, a difference of 0.23%), Immigrants from Caribbean ($48,535, a difference of 1.2%), Immigrants from Dominica ($50,071, a difference of 1.9%), and Cape Verdean ($50,077, a difference of 1.9%).
| Demographics | Rating | Rank | Householder Income Over 65 years |
| Immigrants | Grenada | 0.0 /100 | #330 | Tragic $50,747 |
| Pima | 0.0 /100 | #331 | Tragic $50,539 |
| Dutch West Indians | 0.0 /100 | #332 | Tragic $50,475 |
| Cape Verdeans | 0.0 /100 | #333 | Tragic $50,077 |
| Immigrants | Dominica | 0.0 /100 | #334 | Tragic $50,071 |
| Crow | 0.0 /100 | #335 | Tragic $49,234 |
| Cubans | 0.0 /100 | #336 | Tragic $49,152 |
| Tohono O'odham | 0.0 /100 | #337 | Tragic $49,121 |
| Immigrants | Caribbean | 0.0 /100 | #338 | Tragic $48,535 |
| Navajo | 0.0 /100 | #339 | Tragic $47,722 |
| Immigrants | Yemen | 0.0 /100 | #340 | Tragic $47,527 |
| Dominicans | 0.0 /100 | #341 | Tragic $46,964 |
| Immigrants | Cabo Verde | 0.0 /100 | #342 | Tragic $46,654 |
| Immigrants | Dominican Republic | 0.0 /100 | #343 | Tragic $45,758 |
| Houma | 0.0 /100 | #344 | Tragic $44,822 |
Demographics Similar to Thais by Householder Income Over 65 years
In terms of householder income over 65 years, the demographic groups most similar to Thais are Bhutanese ($72,288, a difference of 0.26%), Cypriot ($71,714, a difference of 0.54%), Immigrants from Hong Kong ($71,567, a difference of 0.74%), Immigrants from India ($72,804, a difference of 0.98%), and Immigrants from Singapore ($72,963, a difference of 1.2%).
| Demographics | Rating | Rank | Householder Income Over 65 years |
| Filipinos | 100.0 /100 | #4 | Exceptional $76,686 |
| Immigrants | Iran | 100.0 /100 | #5 | Exceptional $75,081 |
| Bolivians | 100.0 /100 | #6 | Exceptional $74,245 |
| Immigrants | Bolivia | 100.0 /100 | #7 | Exceptional $73,434 |
| Immigrants | Singapore | 100.0 /100 | #8 | Exceptional $72,963 |
| Immigrants | India | 100.0 /100 | #9 | Exceptional $72,804 |
| Bhutanese | 100.0 /100 | #10 | Exceptional $72,288 |
| Thais | 100.0 /100 | #11 | Exceptional $72,099 |
| Cypriots | 100.0 /100 | #12 | Exceptional $71,714 |
| Immigrants | Hong Kong | 100.0 /100 | #13 | Exceptional $71,567 |
| Burmese | 100.0 /100 | #14 | Exceptional $71,139 |
| Native Hawaiians | 100.0 /100 | #15 | Exceptional $71,021 |
| Okinawans | 100.0 /100 | #16 | Exceptional $70,846 |
| Immigrants | Korea | 100.0 /100 | #17 | Exceptional $70,696 |
| Eastern Europeans | 100.0 /100 | #18 | Exceptional $70,470 |