Tohono O'odham vs Immigrants from Bahamas Householder Income Over 65 years
COMPARE
Tohono O'odham
Immigrants from Bahamas
Householder Income Over 65 years
Householder Income Over 65 years Comparison
Tohono O'odham
Immigrants from Bahamas
$49,121
HOUSEHOLDER INCOME OVER 65 YEARS
0.0/ 100
METRIC RATING
337th/ 347
METRIC RANK
$53,174
HOUSEHOLDER INCOME OVER 65 YEARS
0.0/ 100
METRIC RATING
300th/ 347
METRIC RANK
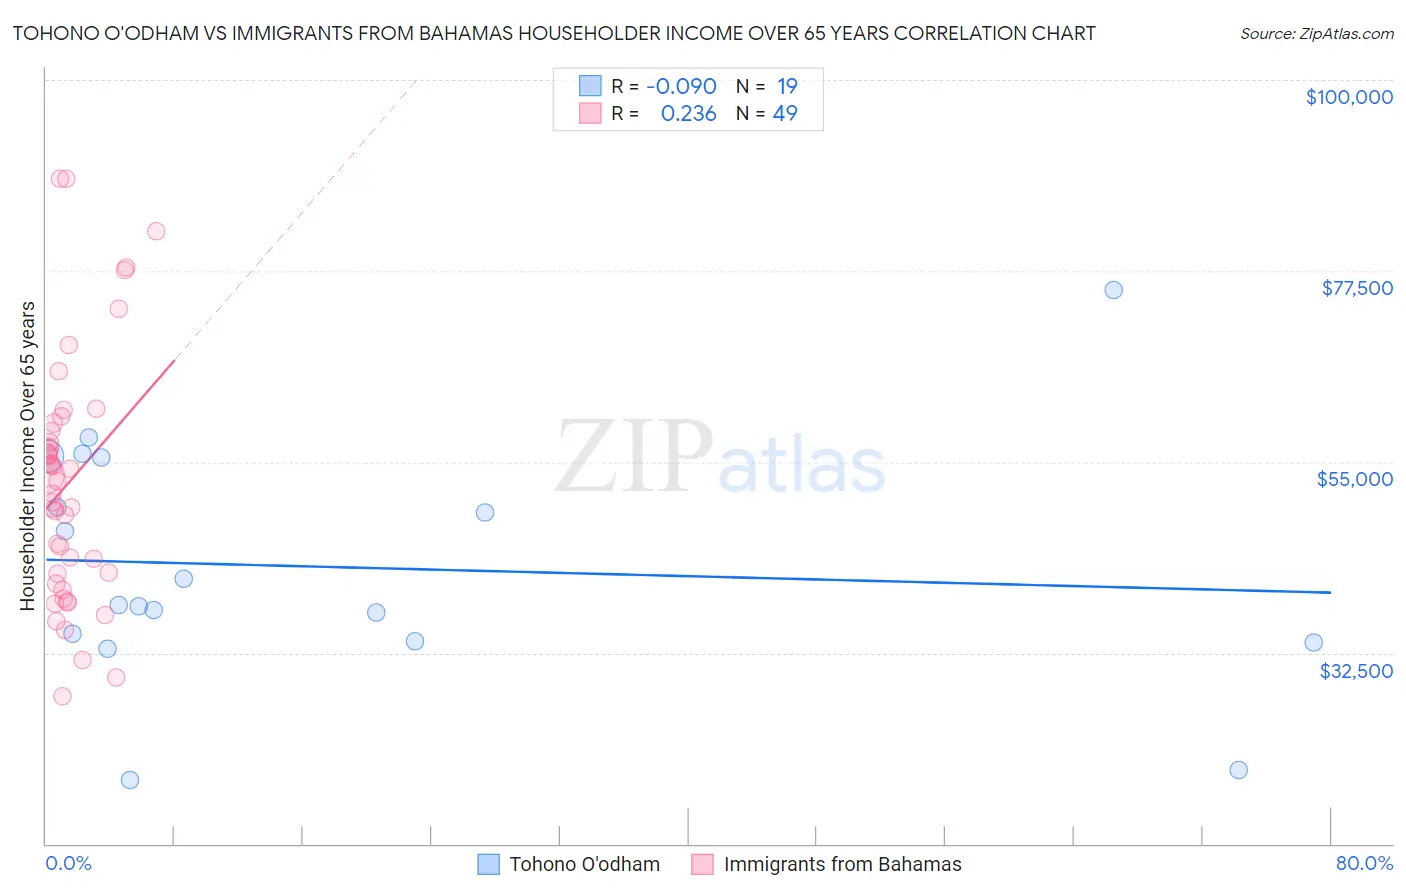
Tohono O'odham vs Immigrants from Bahamas Householder Income Over 65 years Correlation Chart
The statistical analysis conducted on geographies consisting of 58,613,194 people shows a slight negative correlation between the proportion of Tohono O'odham and household income with householder over the age of 65 in the United States with a correlation coefficient (R) of -0.090 and weighted average of $49,121. Similarly, the statistical analysis conducted on geographies consisting of 104,535,567 people shows a weak positive correlation between the proportion of Immigrants from Bahamas and household income with householder over the age of 65 in the United States with a correlation coefficient (R) of 0.236 and weighted average of $53,174, a difference of 8.3%.
Householder Income Over 65 years Correlation Summary
| Measurement | Tohono O'odham | Immigrants from Bahamas |
| Minimum | $17,500 | $27,353 |
| Maximum | $75,324 | $88,339 |
| Range | $57,824 | $60,986 |
| Mean | $42,619 | $52,591 |
| Median | $38,125 | $52,760 |
| Interquartile 25% (IQ1) | $33,875 | $41,261 |
| Interquartile 75% (IQ3) | $55,494 | $59,091 |
| Interquartile Range (IQR) | $21,619 | $17,831 |
| Standard Deviation (Sample) | $14,019 | $14,436 |
| Standard Deviation (Population) | $13,645 | $14,288 |
Similar Demographics by Householder Income Over 65 years
Demographics Similar to Tohono O'odham by Householder Income Over 65 years
In terms of householder income over 65 years, the demographic groups most similar to Tohono O'odham are Cuban ($49,152, a difference of 0.060%), Crow ($49,234, a difference of 0.23%), Immigrants from Caribbean ($48,535, a difference of 1.2%), Immigrants from Dominica ($50,071, a difference of 1.9%), and Cape Verdean ($50,077, a difference of 1.9%).
| Demographics | Rating | Rank | Householder Income Over 65 years |
| Immigrants | Grenada | 0.0 /100 | #330 | Tragic $50,747 |
| Pima | 0.0 /100 | #331 | Tragic $50,539 |
| Dutch West Indians | 0.0 /100 | #332 | Tragic $50,475 |
| Cape Verdeans | 0.0 /100 | #333 | Tragic $50,077 |
| Immigrants | Dominica | 0.0 /100 | #334 | Tragic $50,071 |
| Crow | 0.0 /100 | #335 | Tragic $49,234 |
| Cubans | 0.0 /100 | #336 | Tragic $49,152 |
| Tohono O'odham | 0.0 /100 | #337 | Tragic $49,121 |
| Immigrants | Caribbean | 0.0 /100 | #338 | Tragic $48,535 |
| Navajo | 0.0 /100 | #339 | Tragic $47,722 |
| Immigrants | Yemen | 0.0 /100 | #340 | Tragic $47,527 |
| Dominicans | 0.0 /100 | #341 | Tragic $46,964 |
| Immigrants | Cabo Verde | 0.0 /100 | #342 | Tragic $46,654 |
| Immigrants | Dominican Republic | 0.0 /100 | #343 | Tragic $45,758 |
| Houma | 0.0 /100 | #344 | Tragic $44,822 |
Demographics Similar to Immigrants from Bahamas by Householder Income Over 65 years
In terms of householder income over 65 years, the demographic groups most similar to Immigrants from Bahamas are Ottawa ($53,217, a difference of 0.080%), Central American Indian ($53,232, a difference of 0.11%), Yuman ($53,110, a difference of 0.12%), Immigrants from Latin America ($53,265, a difference of 0.17%), and Spanish American Indian ($53,077, a difference of 0.18%).
| Demographics | Rating | Rank | Householder Income Over 65 years |
| Immigrants | Belize | 0.0 /100 | #293 | Tragic $53,665 |
| Senegalese | 0.0 /100 | #294 | Tragic $53,591 |
| Immigrants | Central America | 0.0 /100 | #295 | Tragic $53,420 |
| Immigrants | Somalia | 0.0 /100 | #296 | Tragic $53,333 |
| Immigrants | Latin America | 0.0 /100 | #297 | Tragic $53,265 |
| Central American Indians | 0.0 /100 | #298 | Tragic $53,232 |
| Ottawa | 0.0 /100 | #299 | Tragic $53,217 |
| Immigrants | Bahamas | 0.0 /100 | #300 | Tragic $53,174 |
| Yuman | 0.0 /100 | #301 | Tragic $53,110 |
| Spanish American Indians | 0.0 /100 | #302 | Tragic $53,077 |
| Choctaw | 0.0 /100 | #303 | Tragic $53,060 |
| Ute | 0.0 /100 | #304 | Tragic $52,949 |
| Pueblo | 0.0 /100 | #305 | Tragic $52,930 |
| Pennsylvania Germans | 0.0 /100 | #306 | Tragic $52,888 |
| Hispanics or Latinos | 0.0 /100 | #307 | Tragic $52,832 |