Tohono O'odham vs Nepalese Householder Income Over 65 years
COMPARE
Tohono O'odham
Nepalese
Householder Income Over 65 years
Householder Income Over 65 years Comparison
Tohono O'odham
Nepalese
$49,121
HOUSEHOLDER INCOME OVER 65 YEARS
0.0/ 100
METRIC RATING
337th/ 347
METRIC RANK
$58,761
HOUSEHOLDER INCOME OVER 65 YEARS
9.0/ 100
METRIC RATING
214th/ 347
METRIC RANK
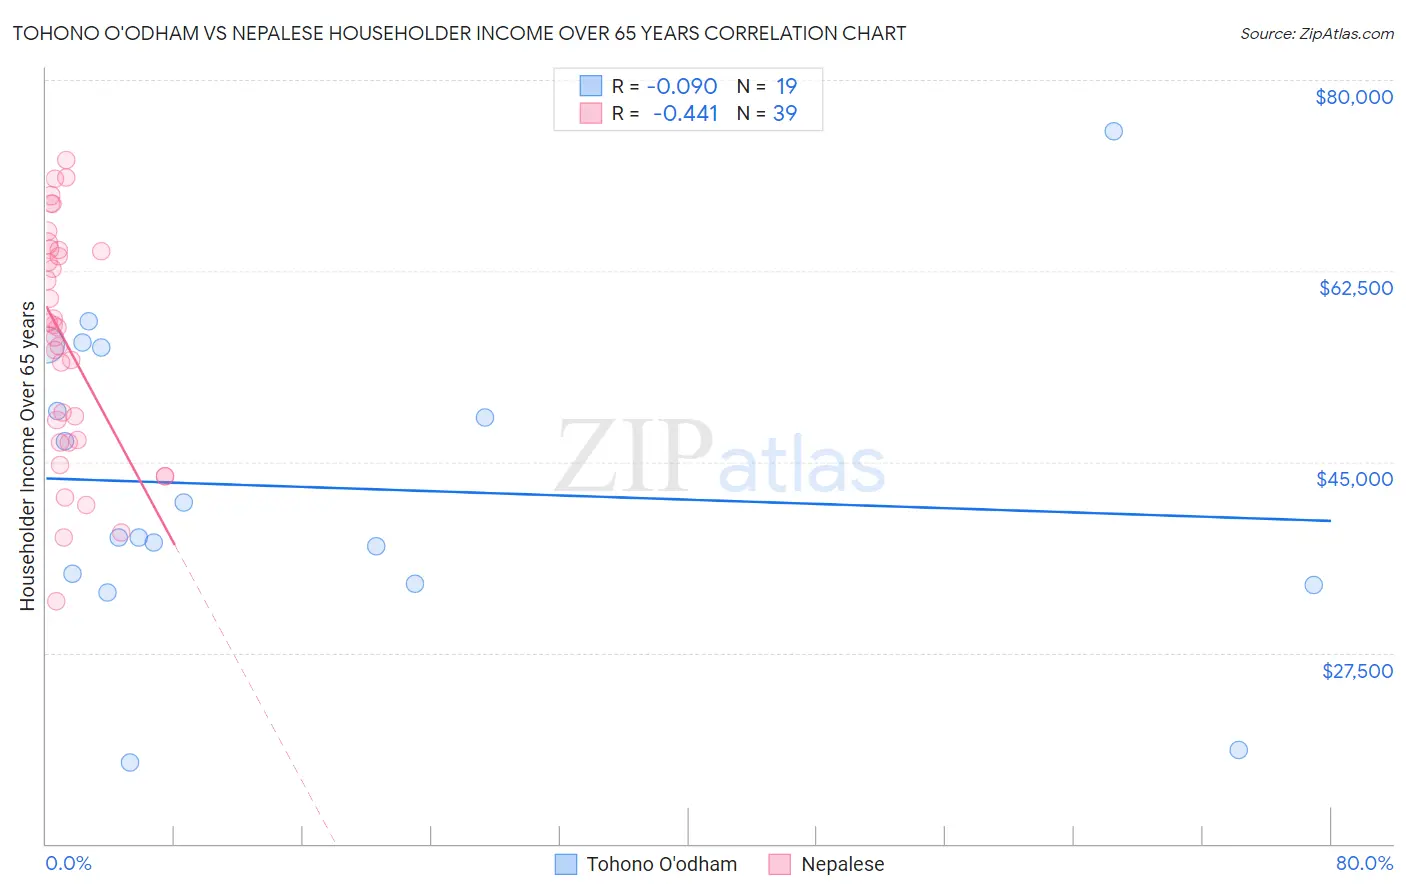
Tohono O'odham vs Nepalese Householder Income Over 65 years Correlation Chart
The statistical analysis conducted on geographies consisting of 58,613,194 people shows a slight negative correlation between the proportion of Tohono O'odham and household income with householder over the age of 65 in the United States with a correlation coefficient (R) of -0.090 and weighted average of $49,121. Similarly, the statistical analysis conducted on geographies consisting of 24,501,136 people shows a moderate negative correlation between the proportion of Nepalese and household income with householder over the age of 65 in the United States with a correlation coefficient (R) of -0.441 and weighted average of $58,761, a difference of 19.6%.
Householder Income Over 65 years Correlation Summary
| Measurement | Tohono O'odham | Nepalese |
| Minimum | $17,500 | $32,174 |
| Maximum | $75,324 | $72,725 |
| Range | $57,824 | $40,551 |
| Mean | $42,619 | $55,785 |
| Median | $38,125 | $57,344 |
| Interquartile 25% (IQ1) | $33,875 | $46,756 |
| Interquartile 75% (IQ3) | $55,494 | $64,405 |
| Interquartile Range (IQR) | $21,619 | $17,649 |
| Standard Deviation (Sample) | $14,019 | $10,626 |
| Standard Deviation (Population) | $13,645 | $10,489 |
Similar Demographics by Householder Income Over 65 years
Demographics Similar to Tohono O'odham by Householder Income Over 65 years
In terms of householder income over 65 years, the demographic groups most similar to Tohono O'odham are Cuban ($49,152, a difference of 0.060%), Crow ($49,234, a difference of 0.23%), Immigrants from Caribbean ($48,535, a difference of 1.2%), Immigrants from Dominica ($50,071, a difference of 1.9%), and Cape Verdean ($50,077, a difference of 1.9%).
| Demographics | Rating | Rank | Householder Income Over 65 years |
| Immigrants | Grenada | 0.0 /100 | #330 | Tragic $50,747 |
| Pima | 0.0 /100 | #331 | Tragic $50,539 |
| Dutch West Indians | 0.0 /100 | #332 | Tragic $50,475 |
| Cape Verdeans | 0.0 /100 | #333 | Tragic $50,077 |
| Immigrants | Dominica | 0.0 /100 | #334 | Tragic $50,071 |
| Crow | 0.0 /100 | #335 | Tragic $49,234 |
| Cubans | 0.0 /100 | #336 | Tragic $49,152 |
| Tohono O'odham | 0.0 /100 | #337 | Tragic $49,121 |
| Immigrants | Caribbean | 0.0 /100 | #338 | Tragic $48,535 |
| Navajo | 0.0 /100 | #339 | Tragic $47,722 |
| Immigrants | Yemen | 0.0 /100 | #340 | Tragic $47,527 |
| Dominicans | 0.0 /100 | #341 | Tragic $46,964 |
| Immigrants | Cabo Verde | 0.0 /100 | #342 | Tragic $46,654 |
| Immigrants | Dominican Republic | 0.0 /100 | #343 | Tragic $45,758 |
| Houma | 0.0 /100 | #344 | Tragic $44,822 |
Demographics Similar to Nepalese by Householder Income Over 65 years
In terms of householder income over 65 years, the demographic groups most similar to Nepalese are Colombian ($58,851, a difference of 0.15%), White/Caucasian ($58,847, a difference of 0.15%), Immigrants from Ghana ($58,624, a difference of 0.23%), Immigrants from Nigeria ($58,942, a difference of 0.31%), and Nigerian ($58,992, a difference of 0.39%).
| Demographics | Rating | Rank | Householder Income Over 65 years |
| Salvadorans | 12.9 /100 | #207 | Poor $59,141 |
| Uruguayans | 12.3 /100 | #208 | Poor $59,090 |
| Slovaks | 11.7 /100 | #209 | Poor $59,039 |
| Nigerians | 11.2 /100 | #210 | Poor $58,992 |
| Immigrants | Nigeria | 10.7 /100 | #211 | Poor $58,942 |
| Colombians | 9.8 /100 | #212 | Tragic $58,851 |
| Whites/Caucasians | 9.8 /100 | #213 | Tragic $58,847 |
| Nepalese | 9.0 /100 | #214 | Tragic $58,761 |
| Immigrants | Ghana | 7.9 /100 | #215 | Tragic $58,624 |
| Immigrants | Middle Africa | 6.2 /100 | #216 | Tragic $58,375 |
| Sudanese | 5.7 /100 | #217 | Tragic $58,281 |
| Panamanians | 5.6 /100 | #218 | Tragic $58,266 |
| Malaysians | 5.5 /100 | #219 | Tragic $58,244 |
| Yugoslavians | 5.5 /100 | #220 | Tragic $58,243 |
| Immigrants | El Salvador | 5.4 /100 | #221 | Tragic $58,226 |