Maltese vs Thai Householder Income Over 65 years
COMPARE
Maltese
Thai
Householder Income Over 65 years
Householder Income Over 65 years Comparison
Maltese
Thais
$66,027
HOUSEHOLDER INCOME OVER 65 YEARS
99.5/ 100
METRIC RATING
61st/ 347
METRIC RANK
$72,099
HOUSEHOLDER INCOME OVER 65 YEARS
100.0/ 100
METRIC RATING
11th/ 347
METRIC RANK
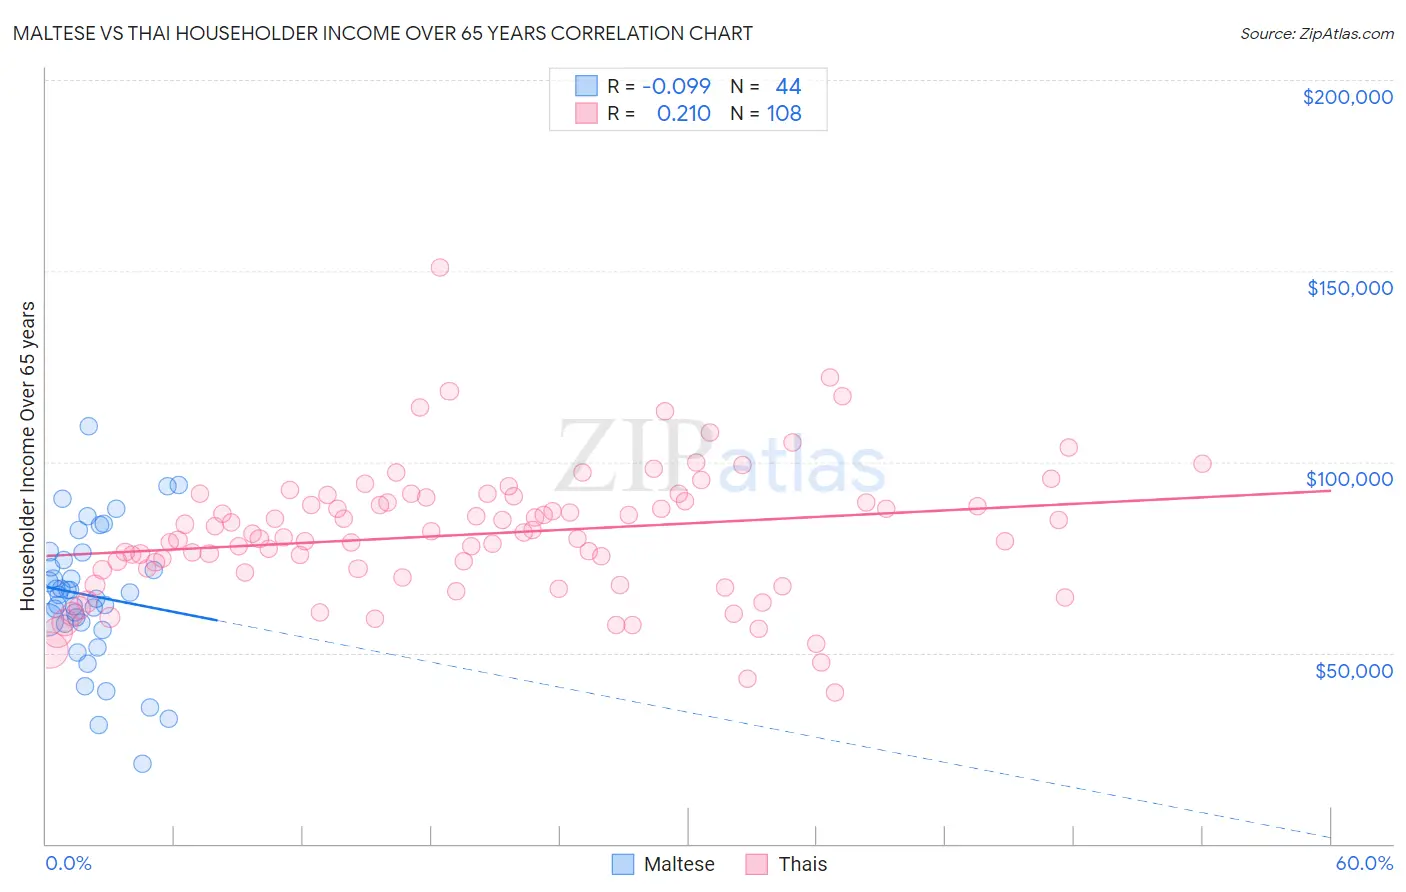
Maltese vs Thai Householder Income Over 65 years Correlation Chart
The statistical analysis conducted on geographies consisting of 126,350,499 people shows a slight negative correlation between the proportion of Maltese and household income with householder over the age of 65 in the United States with a correlation coefficient (R) of -0.099 and weighted average of $66,027. Similarly, the statistical analysis conducted on geographies consisting of 473,553,287 people shows a weak positive correlation between the proportion of Thais and household income with householder over the age of 65 in the United States with a correlation coefficient (R) of 0.210 and weighted average of $72,099, a difference of 9.2%.
Householder Income Over 65 years Correlation Summary
| Measurement | Maltese | Thai |
| Minimum | $20,833 | $39,750 |
| Maximum | $109,444 | $150,903 |
| Range | $88,611 | $111,153 |
| Mean | $65,008 | $81,057 |
| Median | $65,396 | $80,676 |
| Interquartile 25% (IQ1) | $57,781 | $71,396 |
| Interquartile 75% (IQ3) | $75,260 | $90,161 |
| Interquartile Range (IQR) | $17,478 | $18,766 |
| Standard Deviation (Sample) | $18,003 | $17,305 |
| Standard Deviation (Population) | $17,797 | $17,224 |
Similar Demographics by Householder Income Over 65 years
Demographics Similar to Maltese by Householder Income Over 65 years
In terms of householder income over 65 years, the demographic groups most similar to Maltese are Immigrants from Sierra Leone ($66,009, a difference of 0.030%), Immigrants from Lithuania ($66,087, a difference of 0.090%), Immigrants from Norway ($66,118, a difference of 0.14%), Immigrants from Philippines ($66,161, a difference of 0.20%), and Marshallese ($65,874, a difference of 0.23%).
| Demographics | Rating | Rank | Householder Income Over 65 years |
| Immigrants | Netherlands | 99.7 /100 | #54 | Exceptional $66,463 |
| Immigrants | Czechoslovakia | 99.7 /100 | #55 | Exceptional $66,376 |
| Laotians | 99.6 /100 | #56 | Exceptional $66,306 |
| Bulgarians | 99.6 /100 | #57 | Exceptional $66,236 |
| Immigrants | Philippines | 99.6 /100 | #58 | Exceptional $66,161 |
| Immigrants | Norway | 99.5 /100 | #59 | Exceptional $66,118 |
| Immigrants | Lithuania | 99.5 /100 | #60 | Exceptional $66,087 |
| Maltese | 99.5 /100 | #61 | Exceptional $66,027 |
| Immigrants | Sierra Leone | 99.5 /100 | #62 | Exceptional $66,009 |
| Marshallese | 99.4 /100 | #63 | Exceptional $65,874 |
| Zimbabweans | 99.4 /100 | #64 | Exceptional $65,854 |
| Immigrants | England | 99.3 /100 | #65 | Exceptional $65,715 |
| South Africans | 99.3 /100 | #66 | Exceptional $65,652 |
| Immigrants | Malaysia | 99.1 /100 | #67 | Exceptional $65,497 |
| Egyptians | 99.1 /100 | #68 | Exceptional $65,441 |
Demographics Similar to Thais by Householder Income Over 65 years
In terms of householder income over 65 years, the demographic groups most similar to Thais are Bhutanese ($72,288, a difference of 0.26%), Cypriot ($71,714, a difference of 0.54%), Immigrants from Hong Kong ($71,567, a difference of 0.74%), Immigrants from India ($72,804, a difference of 0.98%), and Immigrants from Singapore ($72,963, a difference of 1.2%).
| Demographics | Rating | Rank | Householder Income Over 65 years |
| Filipinos | 100.0 /100 | #4 | Exceptional $76,686 |
| Immigrants | Iran | 100.0 /100 | #5 | Exceptional $75,081 |
| Bolivians | 100.0 /100 | #6 | Exceptional $74,245 |
| Immigrants | Bolivia | 100.0 /100 | #7 | Exceptional $73,434 |
| Immigrants | Singapore | 100.0 /100 | #8 | Exceptional $72,963 |
| Immigrants | India | 100.0 /100 | #9 | Exceptional $72,804 |
| Bhutanese | 100.0 /100 | #10 | Exceptional $72,288 |
| Thais | 100.0 /100 | #11 | Exceptional $72,099 |
| Cypriots | 100.0 /100 | #12 | Exceptional $71,714 |
| Immigrants | Hong Kong | 100.0 /100 | #13 | Exceptional $71,567 |
| Burmese | 100.0 /100 | #14 | Exceptional $71,139 |
| Native Hawaiians | 100.0 /100 | #15 | Exceptional $71,021 |
| Okinawans | 100.0 /100 | #16 | Exceptional $70,846 |
| Immigrants | Korea | 100.0 /100 | #17 | Exceptional $70,696 |
| Eastern Europeans | 100.0 /100 | #18 | Exceptional $70,470 |