Tohono O'odham vs Malaysian Householder Income Over 65 years
COMPARE
Tohono O'odham
Malaysian
Householder Income Over 65 years
Householder Income Over 65 years Comparison
Tohono O'odham
Malaysians
$49,121
HOUSEHOLDER INCOME OVER 65 YEARS
0.0/ 100
METRIC RATING
337th/ 347
METRIC RANK
$58,244
HOUSEHOLDER INCOME OVER 65 YEARS
5.5/ 100
METRIC RATING
219th/ 347
METRIC RANK
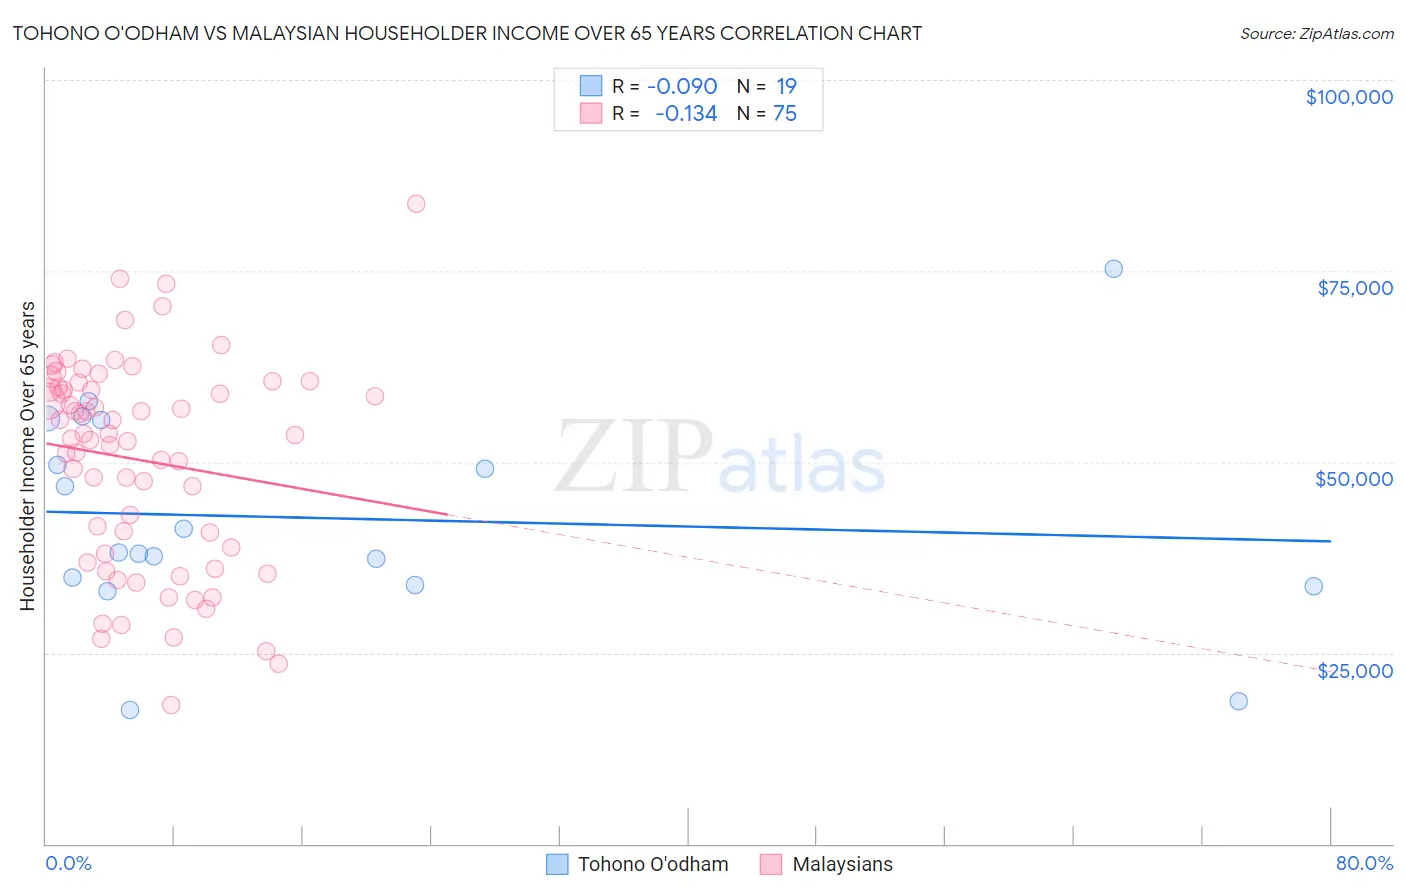
Tohono O'odham vs Malaysian Householder Income Over 65 years Correlation Chart
The statistical analysis conducted on geographies consisting of 58,613,194 people shows a slight negative correlation between the proportion of Tohono O'odham and household income with householder over the age of 65 in the United States with a correlation coefficient (R) of -0.090 and weighted average of $49,121. Similarly, the statistical analysis conducted on geographies consisting of 225,600,084 people shows a poor negative correlation between the proportion of Malaysians and household income with householder over the age of 65 in the United States with a correlation coefficient (R) of -0.134 and weighted average of $58,244, a difference of 18.6%.
Householder Income Over 65 years Correlation Summary
| Measurement | Tohono O'odham | Malaysian |
| Minimum | $17,500 | $18,125 |
| Maximum | $75,324 | $83,750 |
| Range | $57,824 | $65,625 |
| Mean | $42,619 | $50,258 |
| Median | $38,125 | $53,597 |
| Interquartile 25% (IQ1) | $33,875 | $37,943 |
| Interquartile 75% (IQ3) | $55,494 | $59,785 |
| Interquartile Range (IQR) | $21,619 | $21,842 |
| Standard Deviation (Sample) | $14,019 | $13,663 |
| Standard Deviation (Population) | $13,645 | $13,572 |
Similar Demographics by Householder Income Over 65 years
Demographics Similar to Tohono O'odham by Householder Income Over 65 years
In terms of householder income over 65 years, the demographic groups most similar to Tohono O'odham are Cuban ($49,152, a difference of 0.060%), Crow ($49,234, a difference of 0.23%), Immigrants from Caribbean ($48,535, a difference of 1.2%), Immigrants from Dominica ($50,071, a difference of 1.9%), and Cape Verdean ($50,077, a difference of 1.9%).
| Demographics | Rating | Rank | Householder Income Over 65 years |
| Immigrants | Grenada | 0.0 /100 | #330 | Tragic $50,747 |
| Pima | 0.0 /100 | #331 | Tragic $50,539 |
| Dutch West Indians | 0.0 /100 | #332 | Tragic $50,475 |
| Cape Verdeans | 0.0 /100 | #333 | Tragic $50,077 |
| Immigrants | Dominica | 0.0 /100 | #334 | Tragic $50,071 |
| Crow | 0.0 /100 | #335 | Tragic $49,234 |
| Cubans | 0.0 /100 | #336 | Tragic $49,152 |
| Tohono O'odham | 0.0 /100 | #337 | Tragic $49,121 |
| Immigrants | Caribbean | 0.0 /100 | #338 | Tragic $48,535 |
| Navajo | 0.0 /100 | #339 | Tragic $47,722 |
| Immigrants | Yemen | 0.0 /100 | #340 | Tragic $47,527 |
| Dominicans | 0.0 /100 | #341 | Tragic $46,964 |
| Immigrants | Cabo Verde | 0.0 /100 | #342 | Tragic $46,654 |
| Immigrants | Dominican Republic | 0.0 /100 | #343 | Tragic $45,758 |
| Houma | 0.0 /100 | #344 | Tragic $44,822 |
Demographics Similar to Malaysians by Householder Income Over 65 years
In terms of householder income over 65 years, the demographic groups most similar to Malaysians are Yugoslavian ($58,243, a difference of 0.0%), Immigrants from El Salvador ($58,226, a difference of 0.030%), Panamanian ($58,266, a difference of 0.040%), Delaware ($58,214, a difference of 0.050%), and Sudanese ($58,281, a difference of 0.060%).
| Demographics | Rating | Rank | Householder Income Over 65 years |
| Colombians | 9.8 /100 | #212 | Tragic $58,851 |
| Whites/Caucasians | 9.8 /100 | #213 | Tragic $58,847 |
| Nepalese | 9.0 /100 | #214 | Tragic $58,761 |
| Immigrants | Ghana | 7.9 /100 | #215 | Tragic $58,624 |
| Immigrants | Middle Africa | 6.2 /100 | #216 | Tragic $58,375 |
| Sudanese | 5.7 /100 | #217 | Tragic $58,281 |
| Panamanians | 5.6 /100 | #218 | Tragic $58,266 |
| Malaysians | 5.5 /100 | #219 | Tragic $58,244 |
| Yugoslavians | 5.5 /100 | #220 | Tragic $58,243 |
| Immigrants | El Salvador | 5.4 /100 | #221 | Tragic $58,226 |
| Delaware | 5.3 /100 | #222 | Tragic $58,214 |
| Tsimshian | 5.2 /100 | #223 | Tragic $58,202 |
| Bermudans | 5.1 /100 | #224 | Tragic $58,171 |
| Venezuelans | 4.4 /100 | #225 | Tragic $58,026 |
| French Canadians | 4.2 /100 | #226 | Tragic $57,975 |