Tohono O'odham vs Immigrants from Sierra Leone Householder Income Over 65 years
COMPARE
Tohono O'odham
Immigrants from Sierra Leone
Householder Income Over 65 years
Householder Income Over 65 years Comparison
Tohono O'odham
Immigrants from Sierra Leone
$49,121
HOUSEHOLDER INCOME OVER 65 YEARS
0.0/ 100
METRIC RATING
337th/ 347
METRIC RANK
$66,009
HOUSEHOLDER INCOME OVER 65 YEARS
99.5/ 100
METRIC RATING
62nd/ 347
METRIC RANK
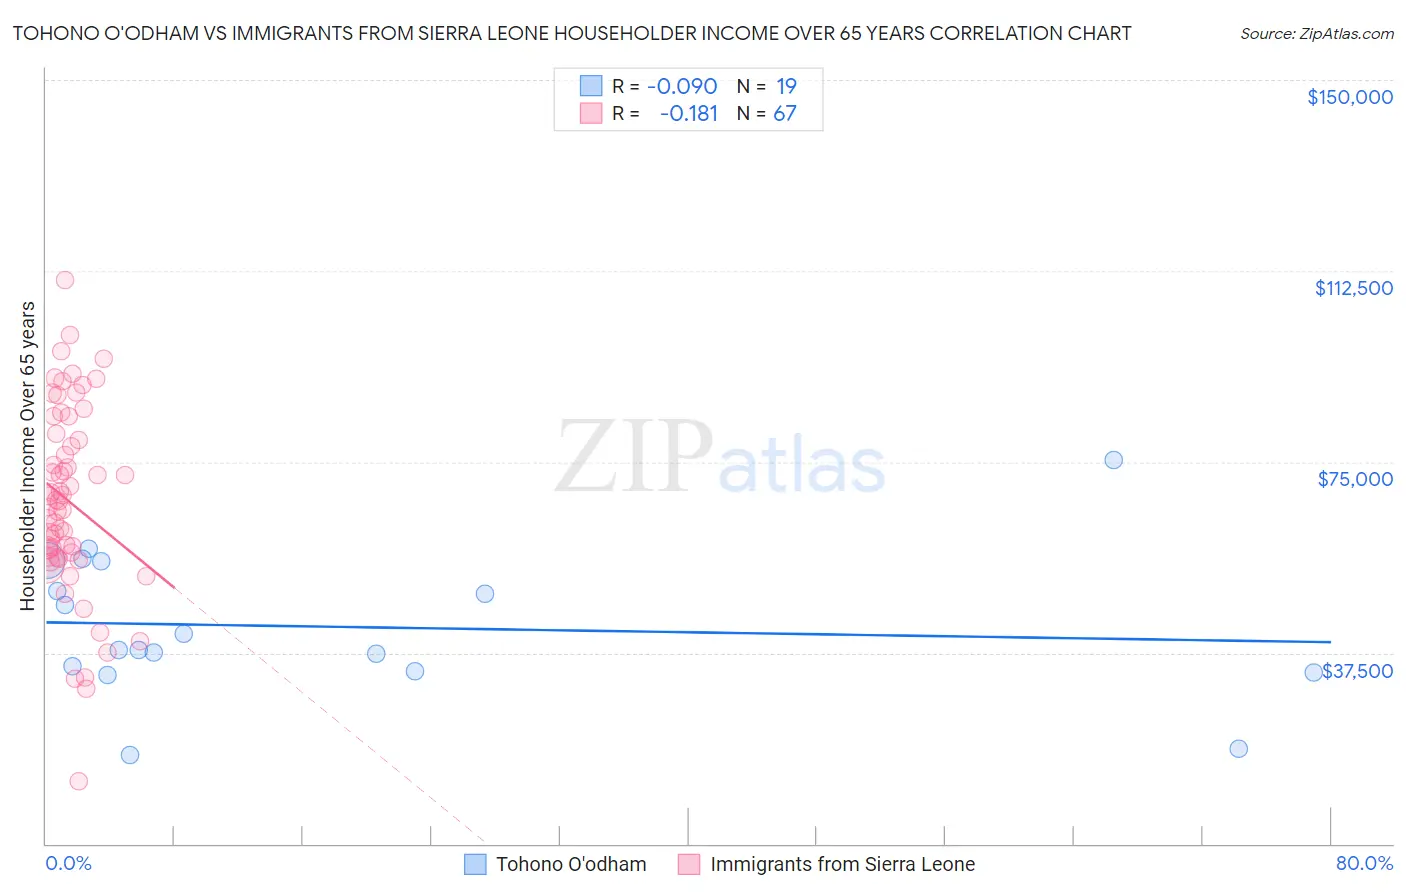
Tohono O'odham vs Immigrants from Sierra Leone Householder Income Over 65 years Correlation Chart
The statistical analysis conducted on geographies consisting of 58,613,194 people shows a slight negative correlation between the proportion of Tohono O'odham and household income with householder over the age of 65 in the United States with a correlation coefficient (R) of -0.090 and weighted average of $49,121. Similarly, the statistical analysis conducted on geographies consisting of 101,523,996 people shows a poor negative correlation between the proportion of Immigrants from Sierra Leone and household income with householder over the age of 65 in the United States with a correlation coefficient (R) of -0.181 and weighted average of $66,009, a difference of 34.4%.
Householder Income Over 65 years Correlation Summary
| Measurement | Tohono O'odham | Immigrants from Sierra Leone |
| Minimum | $17,500 | $12,169 |
| Maximum | $75,324 | $110,741 |
| Range | $57,824 | $98,572 |
| Mean | $42,619 | $67,267 |
| Median | $38,125 | $67,287 |
| Interquartile 25% (IQ1) | $33,875 | $56,276 |
| Interquartile 75% (IQ3) | $55,494 | $80,544 |
| Interquartile Range (IQR) | $21,619 | $24,267 |
| Standard Deviation (Sample) | $14,019 | $18,521 |
| Standard Deviation (Population) | $13,645 | $18,383 |
Similar Demographics by Householder Income Over 65 years
Demographics Similar to Tohono O'odham by Householder Income Over 65 years
In terms of householder income over 65 years, the demographic groups most similar to Tohono O'odham are Cuban ($49,152, a difference of 0.060%), Crow ($49,234, a difference of 0.23%), Immigrants from Caribbean ($48,535, a difference of 1.2%), Immigrants from Dominica ($50,071, a difference of 1.9%), and Cape Verdean ($50,077, a difference of 1.9%).
| Demographics | Rating | Rank | Householder Income Over 65 years |
| Immigrants | Grenada | 0.0 /100 | #330 | Tragic $50,747 |
| Pima | 0.0 /100 | #331 | Tragic $50,539 |
| Dutch West Indians | 0.0 /100 | #332 | Tragic $50,475 |
| Cape Verdeans | 0.0 /100 | #333 | Tragic $50,077 |
| Immigrants | Dominica | 0.0 /100 | #334 | Tragic $50,071 |
| Crow | 0.0 /100 | #335 | Tragic $49,234 |
| Cubans | 0.0 /100 | #336 | Tragic $49,152 |
| Tohono O'odham | 0.0 /100 | #337 | Tragic $49,121 |
| Immigrants | Caribbean | 0.0 /100 | #338 | Tragic $48,535 |
| Navajo | 0.0 /100 | #339 | Tragic $47,722 |
| Immigrants | Yemen | 0.0 /100 | #340 | Tragic $47,527 |
| Dominicans | 0.0 /100 | #341 | Tragic $46,964 |
| Immigrants | Cabo Verde | 0.0 /100 | #342 | Tragic $46,654 |
| Immigrants | Dominican Republic | 0.0 /100 | #343 | Tragic $45,758 |
| Houma | 0.0 /100 | #344 | Tragic $44,822 |
Demographics Similar to Immigrants from Sierra Leone by Householder Income Over 65 years
In terms of householder income over 65 years, the demographic groups most similar to Immigrants from Sierra Leone are Maltese ($66,027, a difference of 0.030%), Immigrants from Lithuania ($66,087, a difference of 0.12%), Immigrants from Norway ($66,118, a difference of 0.17%), Marshallese ($65,874, a difference of 0.21%), and Immigrants from Philippines ($66,161, a difference of 0.23%).
| Demographics | Rating | Rank | Householder Income Over 65 years |
| Immigrants | Czechoslovakia | 99.7 /100 | #55 | Exceptional $66,376 |
| Laotians | 99.6 /100 | #56 | Exceptional $66,306 |
| Bulgarians | 99.6 /100 | #57 | Exceptional $66,236 |
| Immigrants | Philippines | 99.6 /100 | #58 | Exceptional $66,161 |
| Immigrants | Norway | 99.5 /100 | #59 | Exceptional $66,118 |
| Immigrants | Lithuania | 99.5 /100 | #60 | Exceptional $66,087 |
| Maltese | 99.5 /100 | #61 | Exceptional $66,027 |
| Immigrants | Sierra Leone | 99.5 /100 | #62 | Exceptional $66,009 |
| Marshallese | 99.4 /100 | #63 | Exceptional $65,874 |
| Zimbabweans | 99.4 /100 | #64 | Exceptional $65,854 |
| Immigrants | England | 99.3 /100 | #65 | Exceptional $65,715 |
| South Africans | 99.3 /100 | #66 | Exceptional $65,652 |
| Immigrants | Malaysia | 99.1 /100 | #67 | Exceptional $65,497 |
| Egyptians | 99.1 /100 | #68 | Exceptional $65,441 |
| Samoans | 99.1 /100 | #69 | Exceptional $65,427 |