Welsh vs Thai Householder Income Over 65 years
COMPARE
Welsh
Thai
Householder Income Over 65 years
Householder Income Over 65 years Comparison
Welsh
Thais
$60,666
HOUSEHOLDER INCOME OVER 65 YEARS
42.2/ 100
METRIC RATING
179th/ 347
METRIC RANK
$72,099
HOUSEHOLDER INCOME OVER 65 YEARS
100.0/ 100
METRIC RATING
11th/ 347
METRIC RANK
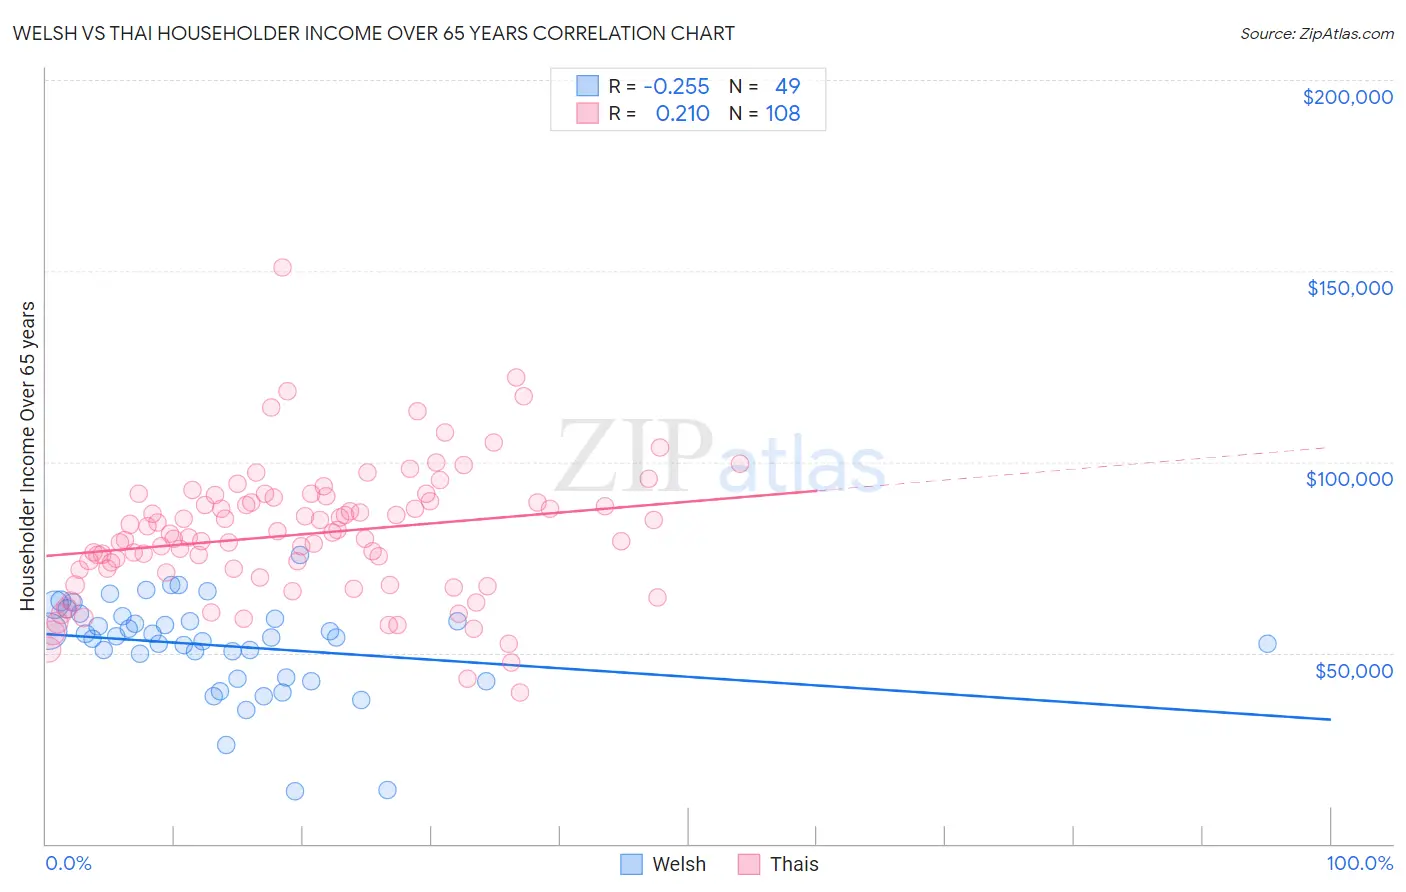
Welsh vs Thai Householder Income Over 65 years Correlation Chart
The statistical analysis conducted on geographies consisting of 525,240,397 people shows a weak negative correlation between the proportion of Welsh and household income with householder over the age of 65 in the United States with a correlation coefficient (R) of -0.255 and weighted average of $60,666. Similarly, the statistical analysis conducted on geographies consisting of 473,553,287 people shows a weak positive correlation between the proportion of Thais and household income with householder over the age of 65 in the United States with a correlation coefficient (R) of 0.210 and weighted average of $72,099, a difference of 18.9%.
Householder Income Over 65 years Correlation Summary
| Measurement | Welsh | Thai |
| Minimum | $13,664 | $39,750 |
| Maximum | $75,625 | $150,903 |
| Range | $61,961 | $111,153 |
| Mean | $51,794 | $81,057 |
| Median | $53,958 | $80,676 |
| Interquartile 25% (IQ1) | $43,354 | $71,396 |
| Interquartile 75% (IQ3) | $59,278 | $90,161 |
| Interquartile Range (IQR) | $15,924 | $18,766 |
| Standard Deviation (Sample) | $12,598 | $17,305 |
| Standard Deviation (Population) | $12,468 | $17,224 |
Similar Demographics by Householder Income Over 65 years
Demographics Similar to Welsh by Householder Income Over 65 years
In terms of householder income over 65 years, the demographic groups most similar to Welsh are Immigrants from Morocco ($60,647, a difference of 0.030%), Yup'ik ($60,727, a difference of 0.10%), Celtic ($60,608, a difference of 0.10%), Alaska Native ($60,748, a difference of 0.14%), and Czechoslovakian ($60,581, a difference of 0.14%).
| Demographics | Rating | Rank | Householder Income Over 65 years |
| Immigrants | Poland | 51.9 /100 | #172 | Average $61,041 |
| Immigrants | Micronesia | 50.8 /100 | #173 | Average $61,000 |
| Luxembourgers | 50.0 /100 | #174 | Average $60,967 |
| Spaniards | 47.3 /100 | #175 | Average $60,866 |
| Spanish | 45.5 /100 | #176 | Average $60,795 |
| Alaska Natives | 44.3 /100 | #177 | Average $60,748 |
| Yup'ik | 43.7 /100 | #178 | Average $60,727 |
| Welsh | 42.2 /100 | #179 | Average $60,666 |
| Immigrants | Morocco | 41.7 /100 | #180 | Average $60,647 |
| Celtics | 40.7 /100 | #181 | Average $60,608 |
| Czechoslovakians | 40.0 /100 | #182 | Average $60,581 |
| Kenyans | 38.4 /100 | #183 | Fair $60,514 |
| Iraqis | 37.2 /100 | #184 | Fair $60,466 |
| Albanians | 32.0 /100 | #185 | Fair $60,249 |
| Slovenes | 31.8 /100 | #186 | Fair $60,241 |
Demographics Similar to Thais by Householder Income Over 65 years
In terms of householder income over 65 years, the demographic groups most similar to Thais are Bhutanese ($72,288, a difference of 0.26%), Cypriot ($71,714, a difference of 0.54%), Immigrants from Hong Kong ($71,567, a difference of 0.74%), Immigrants from India ($72,804, a difference of 0.98%), and Immigrants from Singapore ($72,963, a difference of 1.2%).
| Demographics | Rating | Rank | Householder Income Over 65 years |
| Filipinos | 100.0 /100 | #4 | Exceptional $76,686 |
| Immigrants | Iran | 100.0 /100 | #5 | Exceptional $75,081 |
| Bolivians | 100.0 /100 | #6 | Exceptional $74,245 |
| Immigrants | Bolivia | 100.0 /100 | #7 | Exceptional $73,434 |
| Immigrants | Singapore | 100.0 /100 | #8 | Exceptional $72,963 |
| Immigrants | India | 100.0 /100 | #9 | Exceptional $72,804 |
| Bhutanese | 100.0 /100 | #10 | Exceptional $72,288 |
| Thais | 100.0 /100 | #11 | Exceptional $72,099 |
| Cypriots | 100.0 /100 | #12 | Exceptional $71,714 |
| Immigrants | Hong Kong | 100.0 /100 | #13 | Exceptional $71,567 |
| Burmese | 100.0 /100 | #14 | Exceptional $71,139 |
| Native Hawaiians | 100.0 /100 | #15 | Exceptional $71,021 |
| Okinawans | 100.0 /100 | #16 | Exceptional $70,846 |
| Immigrants | Korea | 100.0 /100 | #17 | Exceptional $70,696 |
| Eastern Europeans | 100.0 /100 | #18 | Exceptional $70,470 |