Immigrants from Uganda vs Thai Householder Income Over 65 years
COMPARE
Immigrants from Uganda
Thai
Householder Income Over 65 years
Householder Income Over 65 years Comparison
Immigrants from Uganda
Thais
$61,976
HOUSEHOLDER INCOME OVER 65 YEARS
74.2/ 100
METRIC RATING
145th/ 347
METRIC RANK
$72,099
HOUSEHOLDER INCOME OVER 65 YEARS
100.0/ 100
METRIC RATING
11th/ 347
METRIC RANK
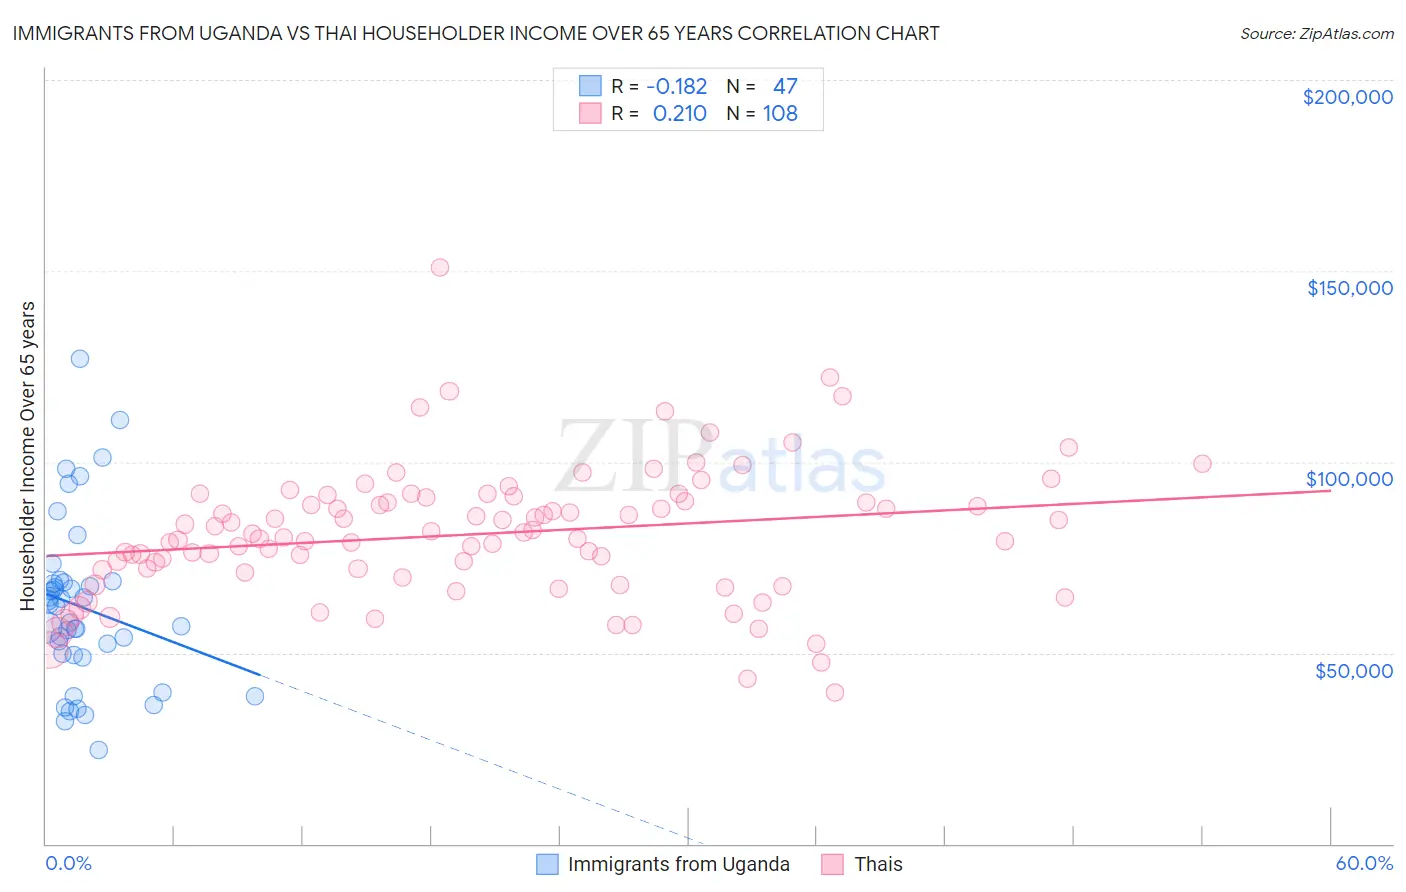
Immigrants from Uganda vs Thai Householder Income Over 65 years Correlation Chart
The statistical analysis conducted on geographies consisting of 125,899,990 people shows a poor negative correlation between the proportion of Immigrants from Uganda and household income with householder over the age of 65 in the United States with a correlation coefficient (R) of -0.182 and weighted average of $61,976. Similarly, the statistical analysis conducted on geographies consisting of 473,553,287 people shows a weak positive correlation between the proportion of Thais and household income with householder over the age of 65 in the United States with a correlation coefficient (R) of 0.210 and weighted average of $72,099, a difference of 16.3%.
Householder Income Over 65 years Correlation Summary
| Measurement | Immigrants from Uganda | Thai |
| Minimum | $24,703 | $39,750 |
| Maximum | $126,964 | $150,903 |
| Range | $102,261 | $111,153 |
| Mean | $61,928 | $81,057 |
| Median | $62,109 | $80,676 |
| Interquartile 25% (IQ1) | $49,375 | $71,396 |
| Interquartile 75% (IQ3) | $68,535 | $90,161 |
| Interquartile Range (IQR) | $19,160 | $18,766 |
| Standard Deviation (Sample) | $21,649 | $17,305 |
| Standard Deviation (Population) | $21,418 | $17,224 |
Similar Demographics by Householder Income Over 65 years
Demographics Similar to Immigrants from Uganda by Householder Income Over 65 years
In terms of householder income over 65 years, the demographic groups most similar to Immigrants from Uganda are Immigrants from Peru ($61,988, a difference of 0.020%), Immigrants from Southern Europe ($61,902, a difference of 0.12%), Immigrants from Nepal ($61,843, a difference of 0.22%), Alsatian ($61,797, a difference of 0.29%), and Immigrants from Belarus ($62,162, a difference of 0.30%).
| Demographics | Rating | Rank | Householder Income Over 65 years |
| Immigrants | Kazakhstan | 80.0 /100 | #138 | Excellent $62,292 |
| Lebanese | 79.9 /100 | #139 | Good $62,287 |
| Arabs | 79.6 /100 | #140 | Good $62,266 |
| Canadians | 79.0 /100 | #141 | Good $62,230 |
| South American Indians | 78.7 /100 | #142 | Good $62,215 |
| Immigrants | Belarus | 77.8 /100 | #143 | Good $62,162 |
| Immigrants | Peru | 74.4 /100 | #144 | Good $61,988 |
| Immigrants | Uganda | 74.2 /100 | #145 | Good $61,976 |
| Immigrants | Southern Europe | 72.7 /100 | #146 | Good $61,902 |
| Immigrants | Nepal | 71.4 /100 | #147 | Good $61,843 |
| Alsatians | 70.5 /100 | #148 | Good $61,797 |
| Scottish | 69.1 /100 | #149 | Good $61,735 |
| Slavs | 68.5 /100 | #150 | Good $61,709 |
| Hungarians | 67.7 /100 | #151 | Good $61,673 |
| Armenians | 67.3 /100 | #152 | Good $61,656 |
Demographics Similar to Thais by Householder Income Over 65 years
In terms of householder income over 65 years, the demographic groups most similar to Thais are Bhutanese ($72,288, a difference of 0.26%), Cypriot ($71,714, a difference of 0.54%), Immigrants from Hong Kong ($71,567, a difference of 0.74%), Immigrants from India ($72,804, a difference of 0.98%), and Immigrants from Singapore ($72,963, a difference of 1.2%).
| Demographics | Rating | Rank | Householder Income Over 65 years |
| Filipinos | 100.0 /100 | #4 | Exceptional $76,686 |
| Immigrants | Iran | 100.0 /100 | #5 | Exceptional $75,081 |
| Bolivians | 100.0 /100 | #6 | Exceptional $74,245 |
| Immigrants | Bolivia | 100.0 /100 | #7 | Exceptional $73,434 |
| Immigrants | Singapore | 100.0 /100 | #8 | Exceptional $72,963 |
| Immigrants | India | 100.0 /100 | #9 | Exceptional $72,804 |
| Bhutanese | 100.0 /100 | #10 | Exceptional $72,288 |
| Thais | 100.0 /100 | #11 | Exceptional $72,099 |
| Cypriots | 100.0 /100 | #12 | Exceptional $71,714 |
| Immigrants | Hong Kong | 100.0 /100 | #13 | Exceptional $71,567 |
| Burmese | 100.0 /100 | #14 | Exceptional $71,139 |
| Native Hawaiians | 100.0 /100 | #15 | Exceptional $71,021 |
| Okinawans | 100.0 /100 | #16 | Exceptional $70,846 |
| Immigrants | Korea | 100.0 /100 | #17 | Exceptional $70,696 |
| Eastern Europeans | 100.0 /100 | #18 | Exceptional $70,470 |