Chilean vs Mongolian Median Earnings
COMPARE
Chilean
Mongolian
Median Earnings
Median Earnings Comparison
Chileans
Mongolians
$48,504
MEDIAN EARNINGS
94.8/ 100
METRIC RATING
122nd/ 347
METRIC RANK
$51,038
MEDIAN EARNINGS
99.8/ 100
METRIC RATING
69th/ 347
METRIC RANK
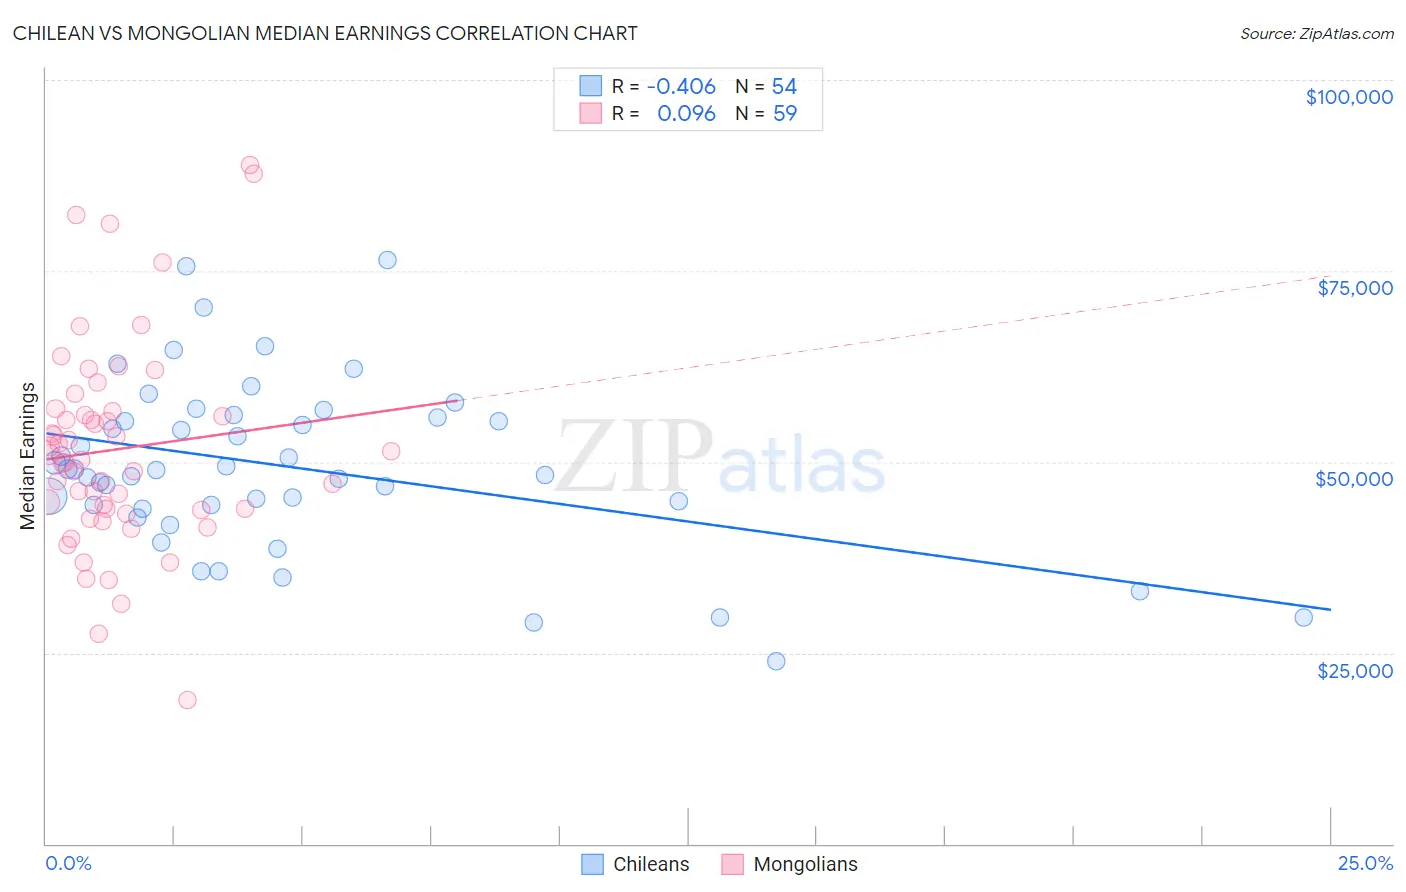
Chilean vs Mongolian Median Earnings Correlation Chart
The statistical analysis conducted on geographies consisting of 256,682,531 people shows a moderate negative correlation between the proportion of Chileans and median earnings in the United States with a correlation coefficient (R) of -0.406 and weighted average of $48,504. Similarly, the statistical analysis conducted on geographies consisting of 140,341,954 people shows a slight positive correlation between the proportion of Mongolians and median earnings in the United States with a correlation coefficient (R) of 0.096 and weighted average of $51,038, a difference of 5.2%.
Median Earnings Correlation Summary
| Measurement | Chilean | Mongolian |
| Minimum | $23,911 | $18,750 |
| Maximum | $76,406 | $88,819 |
| Range | $52,495 | $70,069 |
| Mean | $49,382 | $51,652 |
| Median | $48,999 | $50,317 |
| Interquartile 25% (IQ1) | $44,321 | $43,750 |
| Interquartile 75% (IQ3) | $55,791 | $56,610 |
| Interquartile Range (IQR) | $11,470 | $12,860 |
| Standard Deviation (Sample) | $11,094 | $13,573 |
| Standard Deviation (Population) | $10,991 | $13,457 |
Similar Demographics by Median Earnings
Demographics Similar to Chileans by Median Earnings
In terms of median earnings, the demographic groups most similar to Chileans are Arab ($48,599, a difference of 0.19%), Carpatho Rusyn ($48,617, a difference of 0.23%), Immigrants from Syria ($48,375, a difference of 0.27%), Brazilian ($48,356, a difference of 0.31%), and Polish ($48,659, a difference of 0.32%).
| Demographics | Rating | Rank | Median Earnings |
| Chinese | 96.7 /100 | #115 | Exceptional $48,836 |
| Koreans | 96.2 /100 | #116 | Exceptional $48,727 |
| Serbians | 95.9 /100 | #117 | Exceptional $48,677 |
| Immigrants | Jordan | 95.9 /100 | #118 | Exceptional $48,673 |
| Poles | 95.8 /100 | #119 | Exceptional $48,659 |
| Carpatho Rusyns | 95.5 /100 | #120 | Exceptional $48,617 |
| Arabs | 95.4 /100 | #121 | Exceptional $48,599 |
| Chileans | 94.8 /100 | #122 | Exceptional $48,504 |
| Immigrants | Syria | 93.9 /100 | #123 | Exceptional $48,375 |
| Brazilians | 93.7 /100 | #124 | Exceptional $48,356 |
| Immigrants | Fiji | 93.3 /100 | #125 | Exceptional $48,305 |
| Assyrians/Chaldeans/Syriacs | 93.3 /100 | #126 | Exceptional $48,304 |
| Sierra Leoneans | 93.1 /100 | #127 | Exceptional $48,286 |
| Immigrants | Philippines | 92.9 /100 | #128 | Exceptional $48,266 |
| Pakistanis | 92.8 /100 | #129 | Exceptional $48,254 |
Demographics Similar to Mongolians by Median Earnings
In terms of median earnings, the demographic groups most similar to Mongolians are Paraguayan ($51,068, a difference of 0.060%), Lithuanian ($50,991, a difference of 0.090%), Immigrants from Ukraine ($50,984, a difference of 0.10%), Immigrants from Spain ($51,092, a difference of 0.11%), and Afghan ($51,112, a difference of 0.15%).
| Demographics | Rating | Rank | Median Earnings |
| Immigrants | Romania | 99.9 /100 | #62 | Exceptional $51,337 |
| Immigrants | Bulgaria | 99.9 /100 | #63 | Exceptional $51,318 |
| New Zealanders | 99.9 /100 | #64 | Exceptional $51,246 |
| Greeks | 99.9 /100 | #65 | Exceptional $51,164 |
| Afghans | 99.9 /100 | #66 | Exceptional $51,112 |
| Immigrants | Spain | 99.9 /100 | #67 | Exceptional $51,092 |
| Paraguayans | 99.9 /100 | #68 | Exceptional $51,068 |
| Mongolians | 99.8 /100 | #69 | Exceptional $51,038 |
| Lithuanians | 99.8 /100 | #70 | Exceptional $50,991 |
| Immigrants | Ukraine | 99.8 /100 | #71 | Exceptional $50,984 |
| Immigrants | Egypt | 99.8 /100 | #72 | Exceptional $50,901 |
| Immigrants | Netherlands | 99.8 /100 | #73 | Exceptional $50,818 |
| South Africans | 99.8 /100 | #74 | Exceptional $50,752 |
| Immigrants | Scotland | 99.8 /100 | #75 | Exceptional $50,741 |
| Immigrants | Italy | 99.7 /100 | #76 | Exceptional $50,581 |