Immigrants from Uzbekistan vs Mongolian Median Earnings
COMPARE
Immigrants from Uzbekistan
Mongolian
Median Earnings
Median Earnings Comparison
Immigrants from Uzbekistan
Mongolians
$50,151
MEDIAN EARNINGS
99.5/ 100
METRIC RATING
87th/ 347
METRIC RANK
$51,038
MEDIAN EARNINGS
99.8/ 100
METRIC RATING
69th/ 347
METRIC RANK
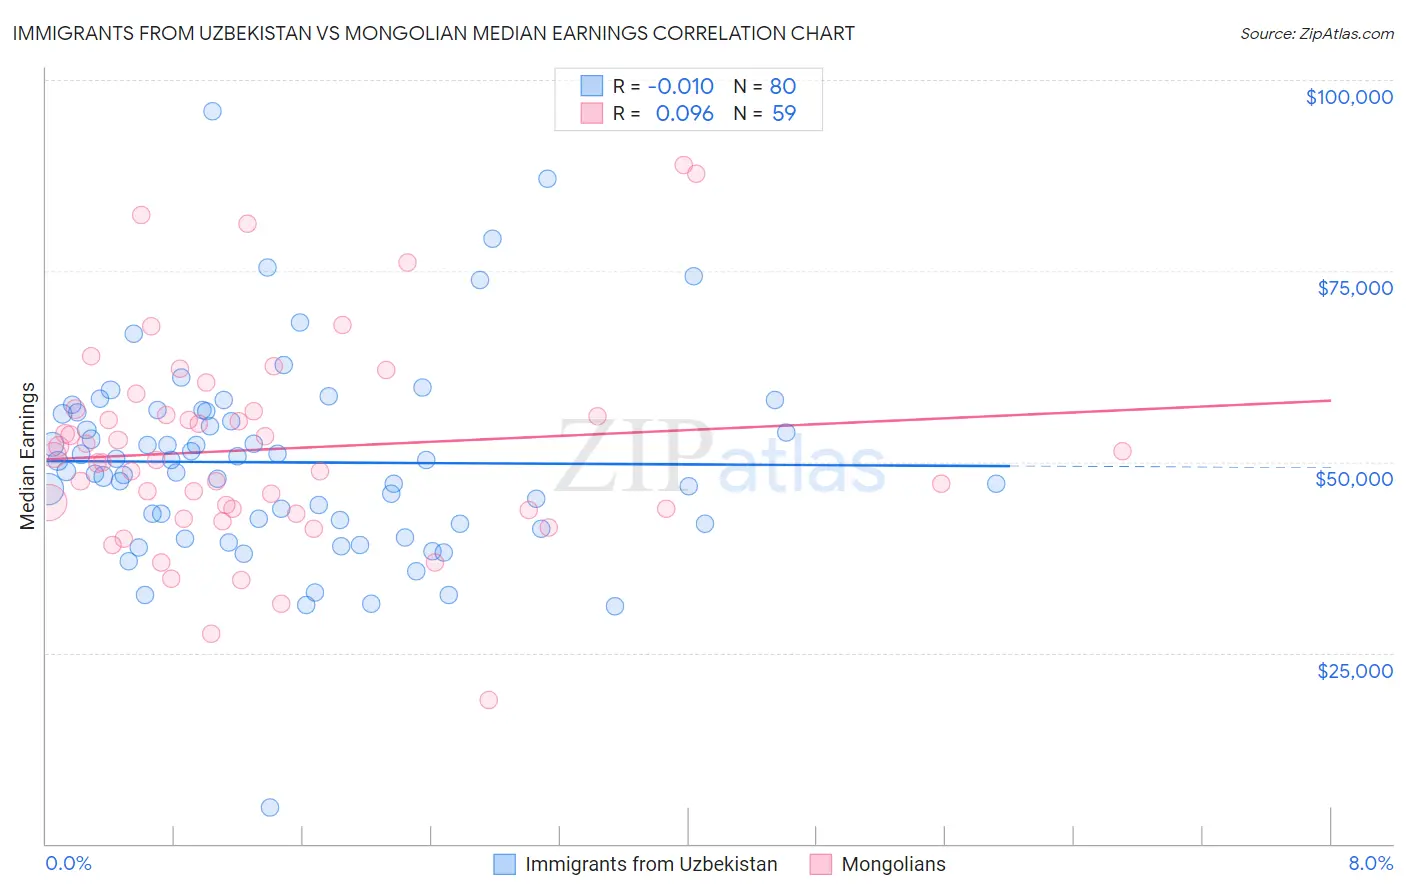
Immigrants from Uzbekistan vs Mongolian Median Earnings Correlation Chart
The statistical analysis conducted on geographies consisting of 118,764,980 people shows no correlation between the proportion of Immigrants from Uzbekistan and median earnings in the United States with a correlation coefficient (R) of -0.010 and weighted average of $50,151. Similarly, the statistical analysis conducted on geographies consisting of 140,341,954 people shows a slight positive correlation between the proportion of Mongolians and median earnings in the United States with a correlation coefficient (R) of 0.096 and weighted average of $51,038, a difference of 1.8%.
Median Earnings Correlation Summary
| Measurement | Immigrants from Uzbekistan | Mongolian |
| Minimum | $4,716 | $18,750 |
| Maximum | $95,833 | $88,819 |
| Range | $91,117 | $70,069 |
| Mean | $49,941 | $51,652 |
| Median | $49,455 | $50,317 |
| Interquartile 25% (IQ1) | $41,888 | $43,750 |
| Interquartile 75% (IQ3) | $56,559 | $56,610 |
| Interquartile Range (IQR) | $14,671 | $12,860 |
| Standard Deviation (Sample) | $13,280 | $13,573 |
| Standard Deviation (Population) | $13,197 | $13,457 |
Demographics Similar to Immigrants from Uzbekistan and Mongolians by Median Earnings
In terms of median earnings, the demographic groups most similar to Immigrants from Uzbekistan are Albanian ($50,116, a difference of 0.070%), Immigrants from Canada ($50,192, a difference of 0.080%), Immigrants from Hungary ($50,227, a difference of 0.15%), Immigrants from Kazakhstan ($50,225, a difference of 0.15%), and Romanian ($50,244, a difference of 0.19%). Similarly, the demographic groups most similar to Mongolians are Paraguayan ($51,068, a difference of 0.060%), Lithuanian ($50,991, a difference of 0.090%), Immigrants from Ukraine ($50,984, a difference of 0.10%), Immigrants from Egypt ($50,901, a difference of 0.27%), and Immigrants from Netherlands ($50,818, a difference of 0.43%).
| Demographics | Rating | Rank | Median Earnings |
| Paraguayans | 99.9 /100 | #68 | Exceptional $51,068 |
| Mongolians | 99.8 /100 | #69 | Exceptional $51,038 |
| Lithuanians | 99.8 /100 | #70 | Exceptional $50,991 |
| Immigrants | Ukraine | 99.8 /100 | #71 | Exceptional $50,984 |
| Immigrants | Egypt | 99.8 /100 | #72 | Exceptional $50,901 |
| Immigrants | Netherlands | 99.8 /100 | #73 | Exceptional $50,818 |
| South Africans | 99.8 /100 | #74 | Exceptional $50,752 |
| Immigrants | Scotland | 99.8 /100 | #75 | Exceptional $50,741 |
| Immigrants | Italy | 99.7 /100 | #76 | Exceptional $50,581 |
| Immigrants | Western Europe | 99.7 /100 | #77 | Exceptional $50,549 |
| Argentineans | 99.6 /100 | #78 | Exceptional $50,399 |
| Laotians | 99.6 /100 | #79 | Exceptional $50,343 |
| Ukrainians | 99.6 /100 | #80 | Exceptional $50,320 |
| Immigrants | Southern Europe | 99.6 /100 | #81 | Exceptional $50,280 |
| Immigrants | Moldova | 99.5 /100 | #82 | Exceptional $50,274 |
| Romanians | 99.5 /100 | #83 | Exceptional $50,244 |
| Immigrants | Hungary | 99.5 /100 | #84 | Exceptional $50,227 |
| Immigrants | Kazakhstan | 99.5 /100 | #85 | Exceptional $50,225 |
| Immigrants | Canada | 99.5 /100 | #86 | Exceptional $50,192 |
| Immigrants | Uzbekistan | 99.5 /100 | #87 | Exceptional $50,151 |
| Albanians | 99.4 /100 | #88 | Exceptional $50,116 |