South American Indian vs Lumbee Householder Income Under 25 years
COMPARE
South American Indian
Lumbee
Householder Income Under 25 years
Householder Income Under 25 years Comparison
South American Indians
Lumbee
$52,979
HOUSEHOLDER INCOME UNDER 25 YEARS
87.3/ 100
METRIC RATING
144th/ 347
METRIC RANK
$34,584
HOUSEHOLDER INCOME UNDER 25 YEARS
0.0/ 100
METRIC RATING
347th/ 347
METRIC RANK
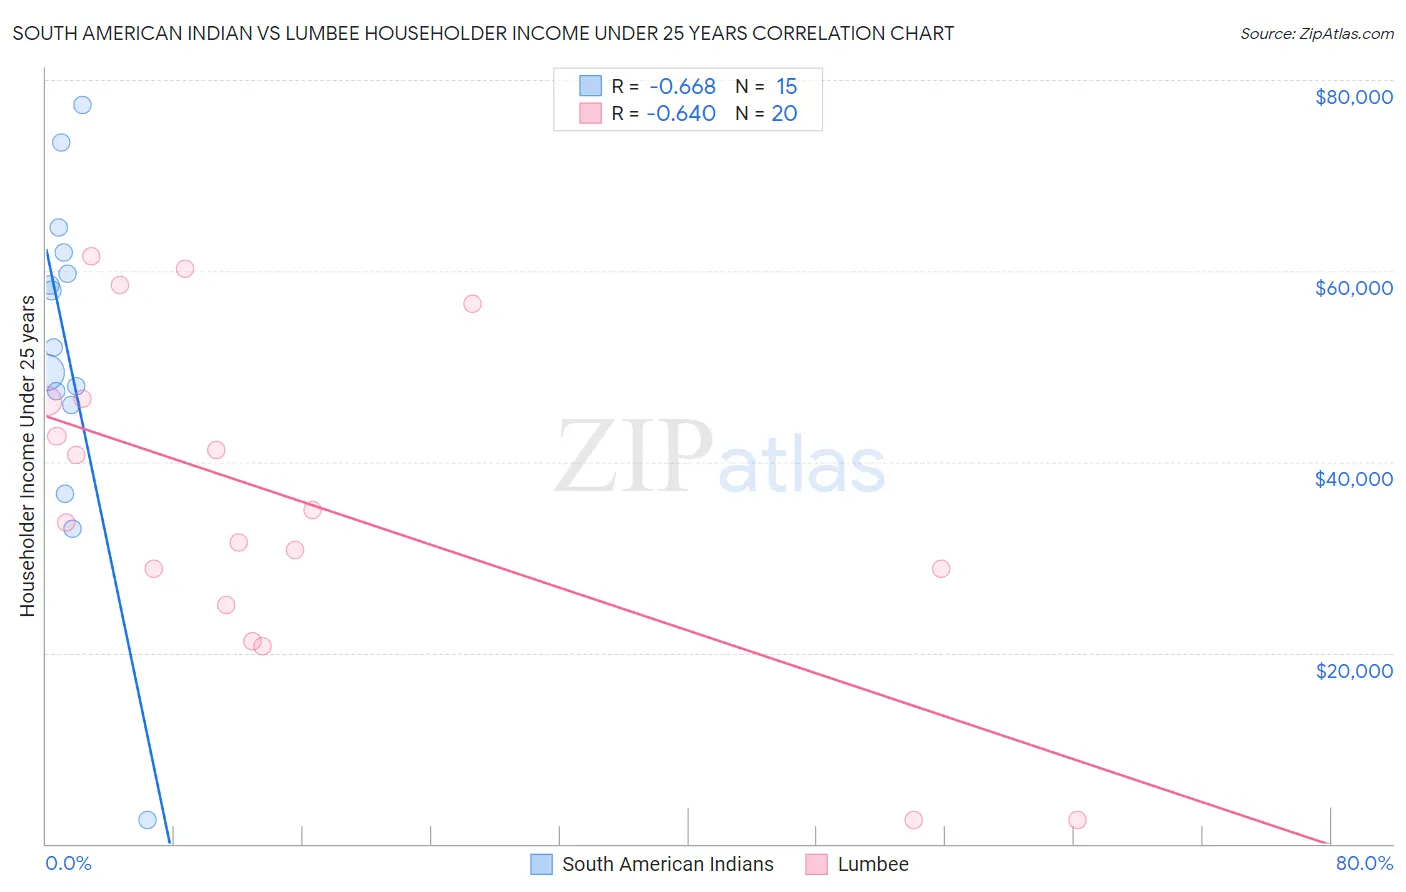
South American Indian vs Lumbee Householder Income Under 25 years Correlation Chart
The statistical analysis conducted on geographies consisting of 149,724,736 people shows a significant negative correlation between the proportion of South American Indians and household income with householder under the age of 25 in the United States with a correlation coefficient (R) of -0.668 and weighted average of $52,979. Similarly, the statistical analysis conducted on geographies consisting of 86,473,772 people shows a significant negative correlation between the proportion of Lumbee and household income with householder under the age of 25 in the United States with a correlation coefficient (R) of -0.640 and weighted average of $34,584, a difference of 53.2%.
Householder Income Under 25 years Correlation Summary
| Measurement | South American Indian | Lumbee |
| Minimum | $2,499 | $2,499 |
| Maximum | $77,389 | $61,485 |
| Range | $74,890 | $58,986 |
| Mean | $51,232 | $35,754 |
| Median | $52,040 | $34,331 |
| Interquartile 25% (IQ1) | $45,962 | $26,875 |
| Interquartile 75% (IQ3) | $61,870 | $46,497 |
| Interquartile Range (IQR) | $15,908 | $19,622 |
| Standard Deviation (Sample) | $18,152 | $16,953 |
| Standard Deviation (Population) | $17,536 | $16,524 |
Similar Demographics by Householder Income Under 25 years
Demographics Similar to South American Indians by Householder Income Under 25 years
In terms of householder income under 25 years, the demographic groups most similar to South American Indians are Immigrants from Armenia ($52,986, a difference of 0.010%), Swedish ($52,986, a difference of 0.010%), Immigrants from Western Europe ($52,957, a difference of 0.040%), Danish ($53,041, a difference of 0.12%), and Hawaiian ($53,078, a difference of 0.19%).
| Demographics | Rating | Rank | Householder Income Under 25 years |
| Immigrants | Barbados | 91.5 /100 | #137 | Exceptional $53,163 |
| Norwegians | 90.8 /100 | #138 | Exceptional $53,127 |
| Costa Ricans | 90.4 /100 | #139 | Exceptional $53,106 |
| Hawaiians | 89.8 /100 | #140 | Excellent $53,078 |
| Danes | 88.9 /100 | #141 | Excellent $53,041 |
| Immigrants | Armenia | 87.5 /100 | #142 | Excellent $52,986 |
| Swedes | 87.5 /100 | #143 | Excellent $52,986 |
| South American Indians | 87.3 /100 | #144 | Excellent $52,979 |
| Immigrants | Western Europe | 86.7 /100 | #145 | Excellent $52,957 |
| Immigrants | Hungary | 81.6 /100 | #146 | Excellent $52,798 |
| Latvians | 81.0 /100 | #147 | Excellent $52,783 |
| French Canadians | 76.5 /100 | #148 | Good $52,672 |
| Scandinavians | 75.7 /100 | #149 | Good $52,654 |
| Immigrants | Costa Rica | 75.2 /100 | #150 | Good $52,643 |
| Immigrants | Scotland | 75.0 /100 | #151 | Good $52,638 |
Demographics Similar to Lumbee by Householder Income Under 25 years
In terms of householder income under 25 years, the demographic groups most similar to Lumbee are Puerto Rican ($39,726, a difference of 14.9%), Navajo ($42,380, a difference of 22.5%), Immigrants from Congo ($43,266, a difference of 25.1%), Immigrants from Yemen ($43,591, a difference of 26.0%), and Arapaho ($44,003, a difference of 27.2%).
| Demographics | Rating | Rank | Householder Income Under 25 years |
| Creek | 0.0 /100 | #333 | Tragic $45,371 |
| Cajuns | 0.0 /100 | #334 | Tragic $45,338 |
| Cheyenne | 0.0 /100 | #335 | Tragic $45,275 |
| Tohono O'odham | 0.0 /100 | #336 | Tragic $45,248 |
| Pueblo | 0.0 /100 | #337 | Tragic $45,018 |
| Chickasaw | 0.0 /100 | #338 | Tragic $44,763 |
| Kiowa | 0.0 /100 | #339 | Tragic $44,733 |
| Blacks/African Americans | 0.0 /100 | #340 | Tragic $44,381 |
| Houma | 0.0 /100 | #341 | Tragic $44,356 |
| Arapaho | 0.0 /100 | #342 | Tragic $44,003 |
| Immigrants | Yemen | 0.0 /100 | #343 | Tragic $43,591 |
| Immigrants | Congo | 0.0 /100 | #344 | Tragic $43,266 |
| Navajo | 0.0 /100 | #345 | Tragic $42,380 |
| Puerto Ricans | 0.0 /100 | #346 | Tragic $39,726 |
| Lumbee | 0.0 /100 | #347 | Tragic $34,584 |