Liberian vs Immigrants from Fiji Median Family Income
COMPARE
Liberian
Immigrants from Fiji
Median Family Income
Median Family Income Comparison
Liberians
Immigrants from Fiji
$91,722
MEDIAN FAMILY INCOME
0.4/ 100
METRIC RATING
262nd/ 347
METRIC RANK
$106,544
MEDIAN FAMILY INCOME
87.8/ 100
METRIC RATING
132nd/ 347
METRIC RANK
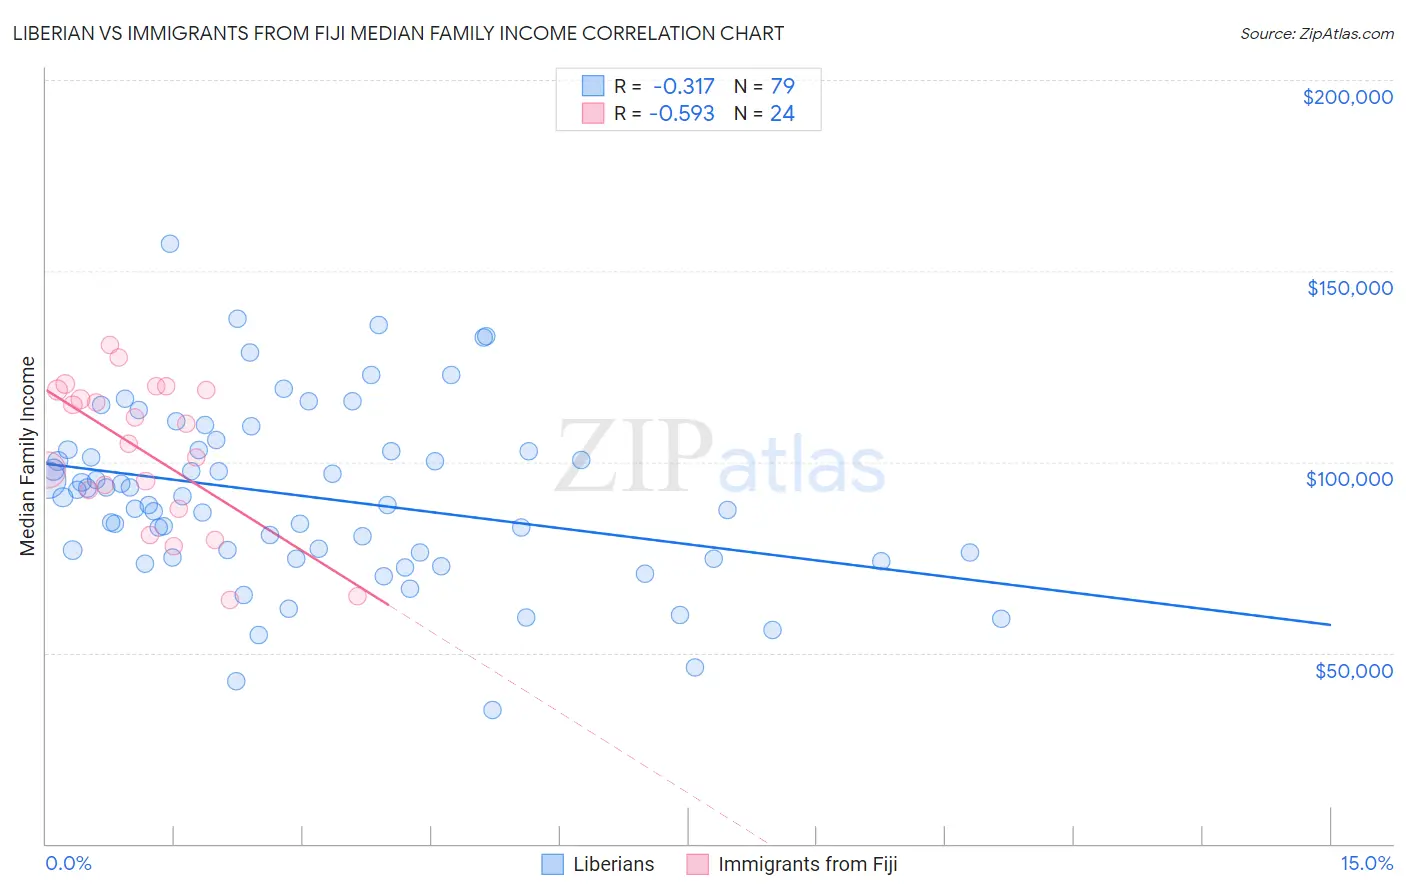
Liberian vs Immigrants from Fiji Median Family Income Correlation Chart
The statistical analysis conducted on geographies consisting of 118,024,273 people shows a mild negative correlation between the proportion of Liberians and median family income in the United States with a correlation coefficient (R) of -0.317 and weighted average of $91,722. Similarly, the statistical analysis conducted on geographies consisting of 93,753,108 people shows a substantial negative correlation between the proportion of Immigrants from Fiji and median family income in the United States with a correlation coefficient (R) of -0.593 and weighted average of $106,544, a difference of 16.2%.
Median Family Income Correlation Summary
| Measurement | Liberian | Immigrants from Fiji |
| Minimum | $34,978 | $63,924 |
| Maximum | $157,083 | $130,465 |
| Range | $122,105 | $66,540 |
| Mean | $90,813 | $102,660 |
| Median | $90,810 | $107,335 |
| Interquartile 25% (IQ1) | $74,960 | $90,188 |
| Interquartile 75% (IQ3) | $103,000 | $118,761 |
| Interquartile Range (IQR) | $28,040 | $28,573 |
| Standard Deviation (Sample) | $23,045 | $19,212 |
| Standard Deviation (Population) | $22,899 | $18,807 |
Similar Demographics by Median Family Income
Demographics Similar to Liberians by Median Family Income
In terms of median family income, the demographic groups most similar to Liberians are Inupiat ($91,730, a difference of 0.010%), Pennsylvania German ($91,763, a difference of 0.040%), Cape Verdean ($91,848, a difference of 0.14%), Immigrants from West Indies ($91,588, a difference of 0.15%), and Osage ($91,926, a difference of 0.22%).
| Demographics | Rating | Rank | Median Family Income |
| Immigrants | Laos | 0.5 /100 | #255 | Tragic $92,239 |
| Nicaraguans | 0.5 /100 | #256 | Tragic $92,231 |
| Americans | 0.4 /100 | #257 | Tragic $92,096 |
| Osage | 0.4 /100 | #258 | Tragic $91,926 |
| Cape Verdeans | 0.4 /100 | #259 | Tragic $91,848 |
| Pennsylvania Germans | 0.4 /100 | #260 | Tragic $91,763 |
| Inupiat | 0.4 /100 | #261 | Tragic $91,730 |
| Liberians | 0.4 /100 | #262 | Tragic $91,722 |
| Immigrants | West Indies | 0.3 /100 | #263 | Tragic $91,588 |
| Senegalese | 0.3 /100 | #264 | Tragic $91,475 |
| Hmong | 0.3 /100 | #265 | Tragic $91,296 |
| Central Americans | 0.3 /100 | #266 | Tragic $91,087 |
| Mexican American Indians | 0.2 /100 | #267 | Tragic $90,918 |
| Cree | 0.2 /100 | #268 | Tragic $90,882 |
| Belizeans | 0.2 /100 | #269 | Tragic $90,880 |
Demographics Similar to Immigrants from Fiji by Median Family Income
In terms of median family income, the demographic groups most similar to Immigrants from Fiji are Ugandan ($106,541, a difference of 0.0%), Canadian ($106,597, a difference of 0.050%), Immigrants from Oceania ($106,453, a difference of 0.090%), Portuguese ($106,286, a difference of 0.24%), and Immigrants from South Eastern Asia ($106,252, a difference of 0.27%).
| Demographics | Rating | Rank | Median Family Income |
| Taiwanese | 91.4 /100 | #125 | Exceptional $107,295 |
| Serbians | 90.8 /100 | #126 | Exceptional $107,157 |
| Lebanese | 90.5 /100 | #127 | Exceptional $107,086 |
| Immigrants | Ethiopia | 90.0 /100 | #128 | Excellent $106,969 |
| Arabs | 89.9 /100 | #129 | Excellent $106,952 |
| Brazilians | 89.8 /100 | #130 | Excellent $106,942 |
| Canadians | 88.1 /100 | #131 | Excellent $106,597 |
| Immigrants | Fiji | 87.8 /100 | #132 | Excellent $106,544 |
| Ugandans | 87.8 /100 | #133 | Excellent $106,541 |
| Immigrants | Oceania | 87.3 /100 | #134 | Excellent $106,453 |
| Portuguese | 86.3 /100 | #135 | Excellent $106,286 |
| Immigrants | South Eastern Asia | 86.1 /100 | #136 | Excellent $106,252 |
| Immigrants | Uganda | 85.7 /100 | #137 | Excellent $106,188 |
| Immigrants | Vietnam | 85.7 /100 | #138 | Excellent $106,186 |
| Luxembourgers | 85.7 /100 | #139 | Excellent $106,183 |