Taiwanese vs Sioux Per Capita Income
COMPARE
Taiwanese
Sioux
Per Capita Income
Per Capita Income Comparison
Taiwanese
Sioux
$46,455
PER CAPITA INCOME
95.8/ 100
METRIC RATING
111th/ 347
METRIC RANK
$33,921
PER CAPITA INCOME
0.0/ 100
METRIC RATING
332nd/ 347
METRIC RANK
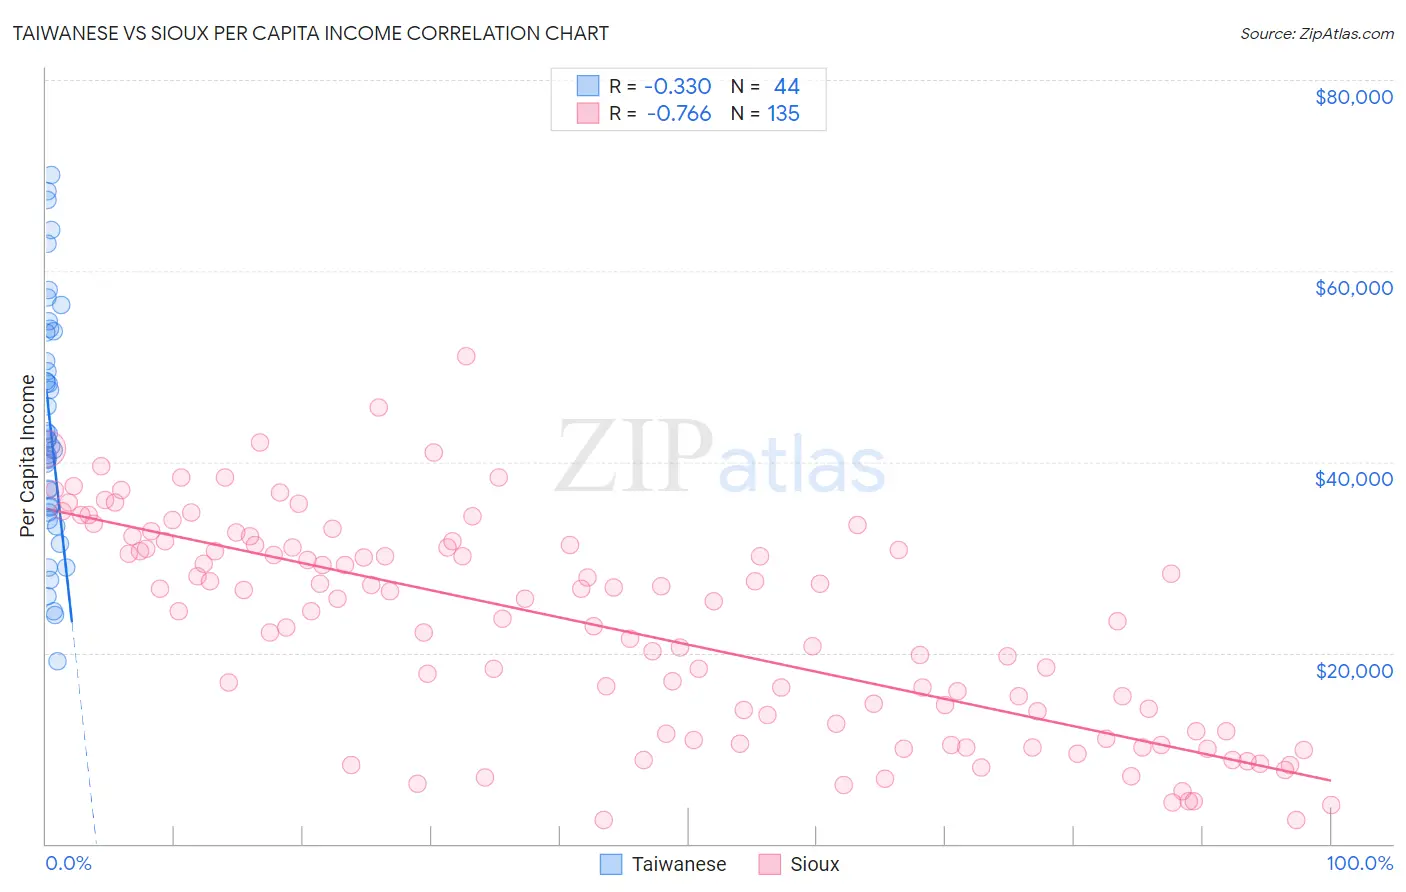
Taiwanese vs Sioux Per Capita Income Correlation Chart
The statistical analysis conducted on geographies consisting of 31,724,936 people shows a mild negative correlation between the proportion of Taiwanese and per capita income in the United States with a correlation coefficient (R) of -0.330 and weighted average of $46,455. Similarly, the statistical analysis conducted on geographies consisting of 234,205,555 people shows a strong negative correlation between the proportion of Sioux and per capita income in the United States with a correlation coefficient (R) of -0.766 and weighted average of $33,921, a difference of 36.9%.
Per Capita Income Correlation Summary
| Measurement | Taiwanese | Sioux |
| Minimum | $19,108 | $2,521 |
| Maximum | $70,046 | $51,123 |
| Range | $50,938 | $48,602 |
| Mean | $43,880 | $22,691 |
| Median | $42,360 | $24,396 |
| Interquartile 25% (IQ1) | $34,944 | $11,727 |
| Interquartile 75% (IQ3) | $53,629 | $31,249 |
| Interquartile Range (IQR) | $18,684 | $19,522 |
| Standard Deviation (Sample) | $12,658 | $11,145 |
| Standard Deviation (Population) | $12,514 | $11,104 |
Similar Demographics by Per Capita Income
Demographics Similar to Taiwanese by Per Capita Income
In terms of per capita income, the demographic groups most similar to Taiwanese are Chilean ($46,459, a difference of 0.010%), Immigrants from Morocco ($46,430, a difference of 0.050%), Immigrants from Albania ($46,387, a difference of 0.14%), Immigrants from Northern Africa ($46,531, a difference of 0.16%), and Immigrants from Kuwait ($46,543, a difference of 0.19%).
| Demographics | Rating | Rank | Per Capita Income |
| Brazilians | 96.8 /100 | #104 | Exceptional $46,700 |
| British | 96.3 /100 | #105 | Exceptional $46,571 |
| Ethiopians | 96.3 /100 | #106 | Exceptional $46,569 |
| Serbians | 96.2 /100 | #107 | Exceptional $46,551 |
| Immigrants | Kuwait | 96.2 /100 | #108 | Exceptional $46,543 |
| Immigrants | Northern Africa | 96.2 /100 | #109 | Exceptional $46,531 |
| Chileans | 95.9 /100 | #110 | Exceptional $46,459 |
| Taiwanese | 95.8 /100 | #111 | Exceptional $46,455 |
| Immigrants | Morocco | 95.7 /100 | #112 | Exceptional $46,430 |
| Immigrants | Albania | 95.5 /100 | #113 | Exceptional $46,387 |
| Afghans | 94.9 /100 | #114 | Exceptional $46,268 |
| Immigrants | Chile | 94.6 /100 | #115 | Exceptional $46,213 |
| Poles | 94.1 /100 | #116 | Exceptional $46,123 |
| Chinese | 93.9 /100 | #117 | Exceptional $46,098 |
| Immigrants | Saudi Arabia | 93.3 /100 | #118 | Exceptional $46,008 |
Demographics Similar to Sioux by Per Capita Income
In terms of per capita income, the demographic groups most similar to Sioux are Immigrants from Mexico ($33,931, a difference of 0.030%), Immigrants from Yemen ($33,696, a difference of 0.67%), Spanish American Indian ($34,195, a difference of 0.81%), Mexican ($34,559, a difference of 1.9%), and Native/Alaskan ($33,279, a difference of 1.9%).
| Demographics | Rating | Rank | Per Capita Income |
| Immigrants | Central America | 0.0 /100 | #325 | Tragic $34,974 |
| Immigrants | Cuba | 0.0 /100 | #326 | Tragic $34,910 |
| Apache | 0.0 /100 | #327 | Tragic $34,886 |
| Menominee | 0.0 /100 | #328 | Tragic $34,578 |
| Mexicans | 0.0 /100 | #329 | Tragic $34,559 |
| Spanish American Indians | 0.0 /100 | #330 | Tragic $34,195 |
| Immigrants | Mexico | 0.0 /100 | #331 | Tragic $33,931 |
| Sioux | 0.0 /100 | #332 | Tragic $33,921 |
| Immigrants | Yemen | 0.0 /100 | #333 | Tragic $33,696 |
| Natives/Alaskans | 0.0 /100 | #334 | Tragic $33,279 |
| Yuman | 0.0 /100 | #335 | Tragic $33,236 |
| Yakama | 0.0 /100 | #336 | Tragic $33,009 |
| Houma | 0.0 /100 | #337 | Tragic $32,996 |
| Arapaho | 0.0 /100 | #338 | Tragic $32,345 |
| Pueblo | 0.0 /100 | #339 | Tragic $32,012 |