Taiwanese vs Immigrants from Norway Per Capita Income
COMPARE
Taiwanese
Immigrants from Norway
Per Capita Income
Per Capita Income Comparison
Taiwanese
Immigrants from Norway
$46,455
PER CAPITA INCOME
95.8/ 100
METRIC RATING
111th/ 347
METRIC RANK
$52,217
PER CAPITA INCOME
100.0/ 100
METRIC RATING
32nd/ 347
METRIC RANK
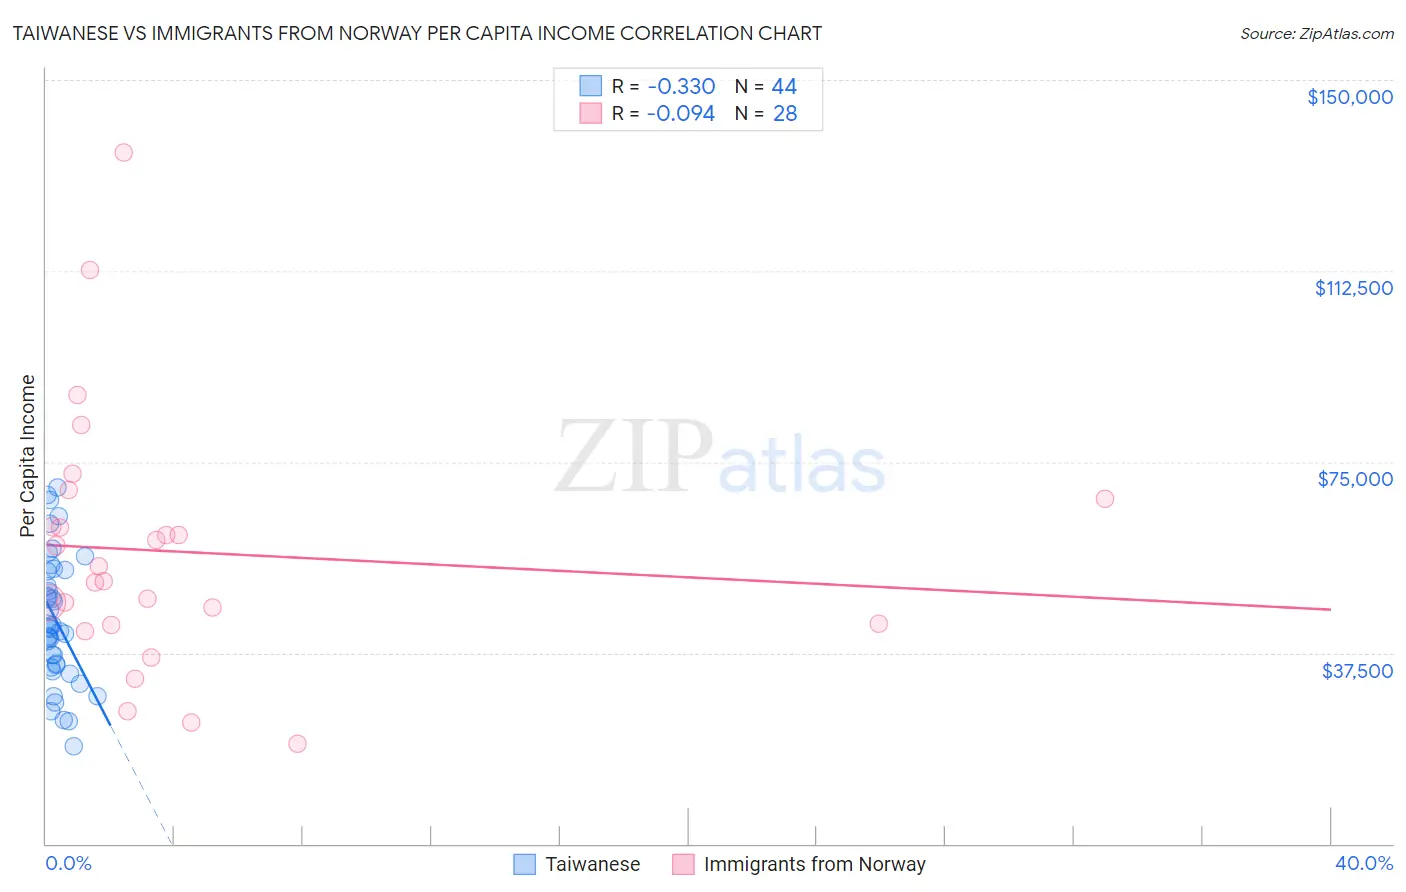
Taiwanese vs Immigrants from Norway Per Capita Income Correlation Chart
The statistical analysis conducted on geographies consisting of 31,724,936 people shows a mild negative correlation between the proportion of Taiwanese and per capita income in the United States with a correlation coefficient (R) of -0.330 and weighted average of $46,455. Similarly, the statistical analysis conducted on geographies consisting of 116,714,031 people shows a slight negative correlation between the proportion of Immigrants from Norway and per capita income in the United States with a correlation coefficient (R) of -0.094 and weighted average of $52,217, a difference of 12.4%.
Per Capita Income Correlation Summary
| Measurement | Taiwanese | Immigrants from Norway |
| Minimum | $19,108 | $19,734 |
| Maximum | $70,046 | $135,828 |
| Range | $50,938 | $116,094 |
| Mean | $43,880 | $57,343 |
| Median | $42,360 | $53,027 |
| Interquartile 25% (IQ1) | $34,944 | $43,092 |
| Interquartile 75% (IQ3) | $53,629 | $65,016 |
| Interquartile Range (IQR) | $18,684 | $21,924 |
| Standard Deviation (Sample) | $12,658 | $25,135 |
| Standard Deviation (Population) | $12,514 | $24,682 |
Similar Demographics by Per Capita Income
Demographics Similar to Taiwanese by Per Capita Income
In terms of per capita income, the demographic groups most similar to Taiwanese are Chilean ($46,459, a difference of 0.010%), Immigrants from Morocco ($46,430, a difference of 0.050%), Immigrants from Albania ($46,387, a difference of 0.14%), Immigrants from Northern Africa ($46,531, a difference of 0.16%), and Immigrants from Kuwait ($46,543, a difference of 0.19%).
| Demographics | Rating | Rank | Per Capita Income |
| Brazilians | 96.8 /100 | #104 | Exceptional $46,700 |
| British | 96.3 /100 | #105 | Exceptional $46,571 |
| Ethiopians | 96.3 /100 | #106 | Exceptional $46,569 |
| Serbians | 96.2 /100 | #107 | Exceptional $46,551 |
| Immigrants | Kuwait | 96.2 /100 | #108 | Exceptional $46,543 |
| Immigrants | Northern Africa | 96.2 /100 | #109 | Exceptional $46,531 |
| Chileans | 95.9 /100 | #110 | Exceptional $46,459 |
| Taiwanese | 95.8 /100 | #111 | Exceptional $46,455 |
| Immigrants | Morocco | 95.7 /100 | #112 | Exceptional $46,430 |
| Immigrants | Albania | 95.5 /100 | #113 | Exceptional $46,387 |
| Afghans | 94.9 /100 | #114 | Exceptional $46,268 |
| Immigrants | Chile | 94.6 /100 | #115 | Exceptional $46,213 |
| Poles | 94.1 /100 | #116 | Exceptional $46,123 |
| Chinese | 93.9 /100 | #117 | Exceptional $46,098 |
| Immigrants | Saudi Arabia | 93.3 /100 | #118 | Exceptional $46,008 |
Demographics Similar to Immigrants from Norway by Per Capita Income
In terms of per capita income, the demographic groups most similar to Immigrants from Norway are Australian ($52,074, a difference of 0.27%), Turkish ($52,391, a difference of 0.33%), Immigrants from Russia ($52,044, a difference of 0.33%), Burmese ($52,005, a difference of 0.41%), and Immigrants from Austria ($52,503, a difference of 0.55%).
| Demographics | Rating | Rank | Per Capita Income |
| Immigrants | Japan | 100.0 /100 | #25 | Exceptional $53,359 |
| Russians | 100.0 /100 | #26 | Exceptional $53,154 |
| Immigrants | South Central Asia | 100.0 /100 | #27 | Exceptional $52,660 |
| Latvians | 100.0 /100 | #28 | Exceptional $52,649 |
| Israelis | 100.0 /100 | #29 | Exceptional $52,596 |
| Immigrants | Austria | 100.0 /100 | #30 | Exceptional $52,503 |
| Turks | 100.0 /100 | #31 | Exceptional $52,391 |
| Immigrants | Norway | 100.0 /100 | #32 | Exceptional $52,217 |
| Australians | 100.0 /100 | #33 | Exceptional $52,074 |
| Immigrants | Russia | 100.0 /100 | #34 | Exceptional $52,044 |
| Burmese | 100.0 /100 | #35 | Exceptional $52,005 |
| Immigrants | Greece | 100.0 /100 | #36 | Exceptional $51,891 |
| Estonians | 100.0 /100 | #37 | Exceptional $51,875 |
| Immigrants | Czechoslovakia | 100.0 /100 | #38 | Exceptional $51,770 |
| Cambodians | 100.0 /100 | #39 | Exceptional $51,731 |