Taiwanese vs Arab Per Capita Income
COMPARE
Taiwanese
Arab
Per Capita Income
Per Capita Income Comparison
Taiwanese
Arabs
$46,455
PER CAPITA INCOME
95.8/ 100
METRIC RATING
111th/ 347
METRIC RANK
$45,662
PER CAPITA INCOME
90.4/ 100
METRIC RATING
130th/ 347
METRIC RANK
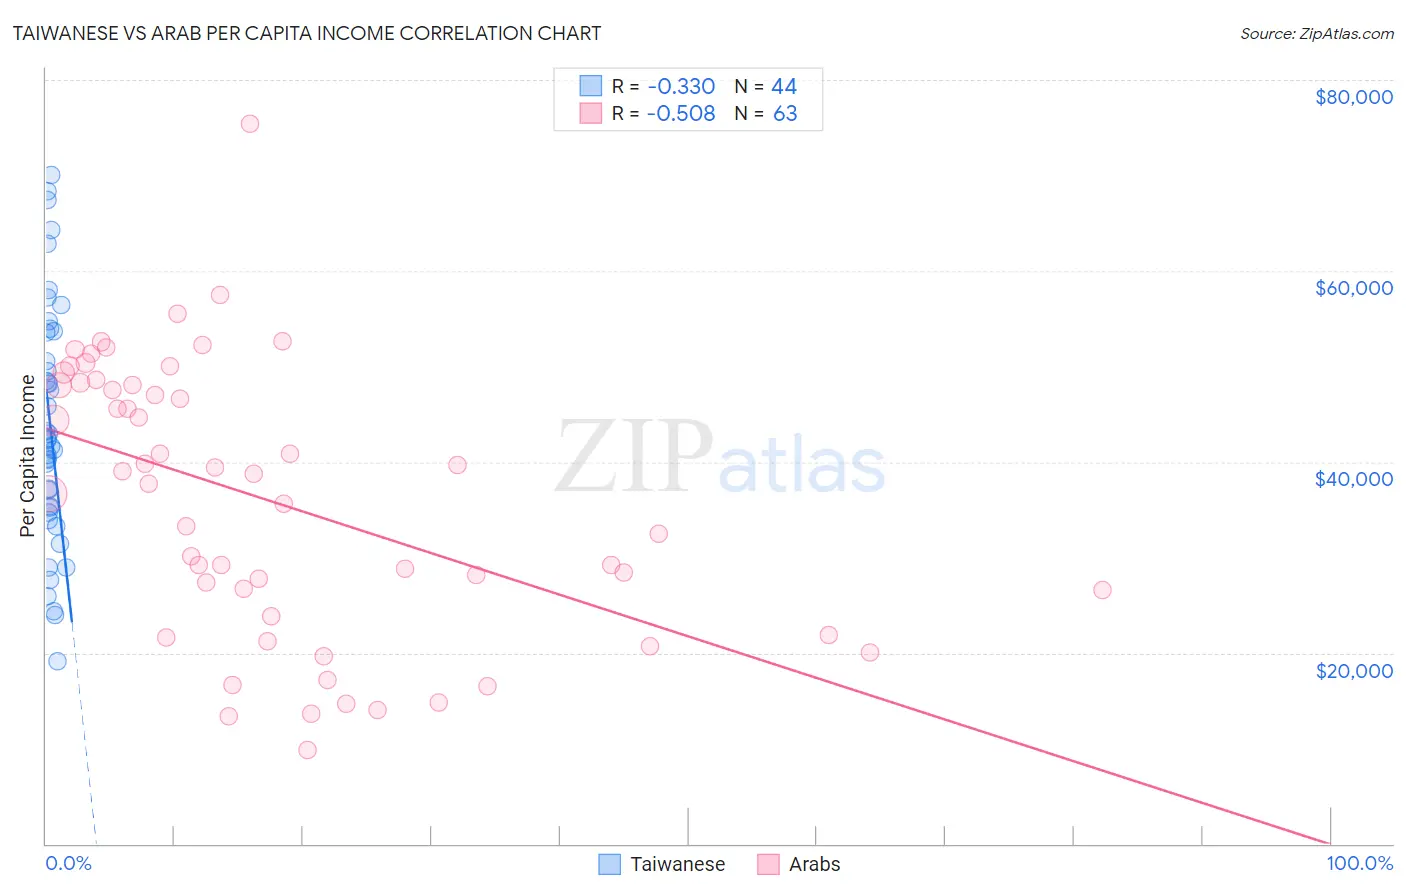
Taiwanese vs Arab Per Capita Income Correlation Chart
The statistical analysis conducted on geographies consisting of 31,724,936 people shows a mild negative correlation between the proportion of Taiwanese and per capita income in the United States with a correlation coefficient (R) of -0.330 and weighted average of $46,455. Similarly, the statistical analysis conducted on geographies consisting of 486,915,485 people shows a substantial negative correlation between the proportion of Arabs and per capita income in the United States with a correlation coefficient (R) of -0.508 and weighted average of $45,662, a difference of 1.7%.
Per Capita Income Correlation Summary
| Measurement | Taiwanese | Arab |
| Minimum | $19,108 | $9,805 |
| Maximum | $70,046 | $75,372 |
| Range | $50,938 | $65,567 |
| Mean | $43,880 | $35,873 |
| Median | $42,360 | $37,723 |
| Interquartile 25% (IQ1) | $34,944 | $23,895 |
| Interquartile 75% (IQ3) | $53,629 | $48,040 |
| Interquartile Range (IQR) | $18,684 | $24,145 |
| Standard Deviation (Sample) | $12,658 | $14,217 |
| Standard Deviation (Population) | $12,514 | $14,103 |
Demographics Similar to Taiwanese and Arabs by Per Capita Income
In terms of per capita income, the demographic groups most similar to Taiwanese are Chilean ($46,459, a difference of 0.010%), Immigrants from Morocco ($46,430, a difference of 0.050%), Immigrants from Albania ($46,387, a difference of 0.14%), Afghan ($46,268, a difference of 0.40%), and Immigrants from Chile ($46,213, a difference of 0.52%). Similarly, the demographic groups most similar to Arabs are Luxembourger ($45,663, a difference of 0.0%), Swedish ($45,750, a difference of 0.19%), Immigrants from Germany ($45,751, a difference of 0.20%), Palestinian ($45,790, a difference of 0.28%), and Zimbabwean ($45,804, a difference of 0.31%).
| Demographics | Rating | Rank | Per Capita Income |
| Chileans | 95.9 /100 | #110 | Exceptional $46,459 |
| Taiwanese | 95.8 /100 | #111 | Exceptional $46,455 |
| Immigrants | Morocco | 95.7 /100 | #112 | Exceptional $46,430 |
| Immigrants | Albania | 95.5 /100 | #113 | Exceptional $46,387 |
| Afghans | 94.9 /100 | #114 | Exceptional $46,268 |
| Immigrants | Chile | 94.6 /100 | #115 | Exceptional $46,213 |
| Poles | 94.1 /100 | #116 | Exceptional $46,123 |
| Chinese | 93.9 /100 | #117 | Exceptional $46,098 |
| Immigrants | Saudi Arabia | 93.3 /100 | #118 | Exceptional $46,008 |
| Immigrants | Poland | 93.1 /100 | #119 | Exceptional $45,979 |
| Immigrants | Ethiopia | 92.7 /100 | #120 | Exceptional $45,923 |
| Canadians | 92.2 /100 | #121 | Exceptional $45,858 |
| Moroccans | 92.1 /100 | #122 | Exceptional $45,854 |
| Lebanese | 92.0 /100 | #123 | Exceptional $45,840 |
| Europeans | 92.0 /100 | #124 | Exceptional $45,836 |
| Zimbabweans | 91.7 /100 | #125 | Exceptional $45,804 |
| Palestinians | 91.6 /100 | #126 | Exceptional $45,790 |
| Immigrants | Germany | 91.3 /100 | #127 | Exceptional $45,751 |
| Swedes | 91.3 /100 | #128 | Exceptional $45,750 |
| Luxembourgers | 90.4 /100 | #129 | Exceptional $45,663 |
| Arabs | 90.4 /100 | #130 | Exceptional $45,662 |