Taiwanese vs Immigrants from Italy Per Capita Income
COMPARE
Taiwanese
Immigrants from Italy
Per Capita Income
Per Capita Income Comparison
Taiwanese
Immigrants from Italy
$46,455
PER CAPITA INCOME
95.8/ 100
METRIC RATING
111th/ 347
METRIC RANK
$48,654
PER CAPITA INCOME
99.6/ 100
METRIC RATING
78th/ 347
METRIC RANK
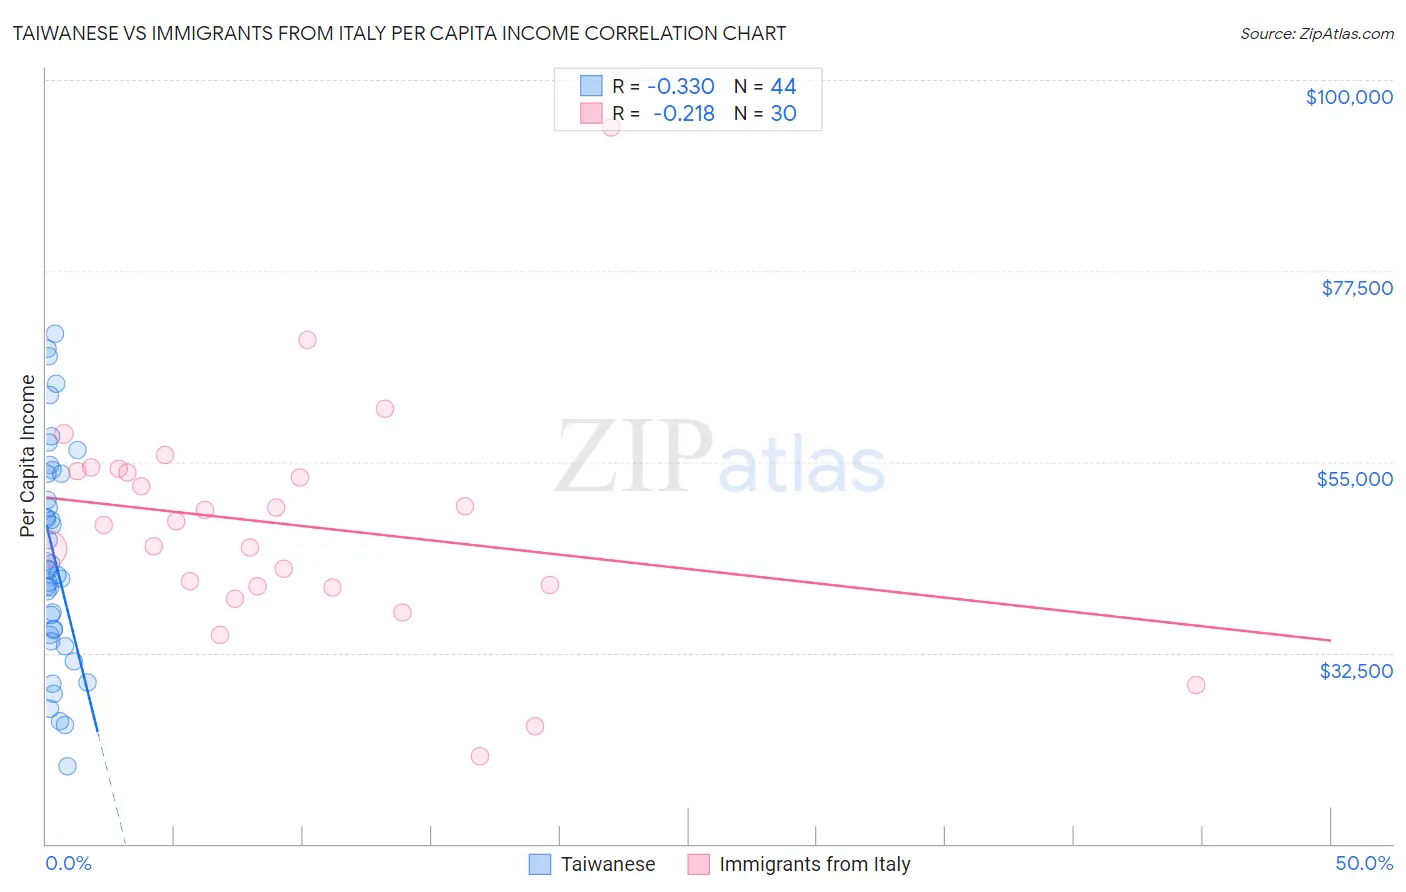
Taiwanese vs Immigrants from Italy Per Capita Income Correlation Chart
The statistical analysis conducted on geographies consisting of 31,724,936 people shows a mild negative correlation between the proportion of Taiwanese and per capita income in the United States with a correlation coefficient (R) of -0.330 and weighted average of $46,455. Similarly, the statistical analysis conducted on geographies consisting of 324,225,966 people shows a weak negative correlation between the proportion of Immigrants from Italy and per capita income in the United States with a correlation coefficient (R) of -0.218 and weighted average of $48,654, a difference of 4.7%.
Per Capita Income Correlation Summary
| Measurement | Taiwanese | Immigrants from Italy |
| Minimum | $19,108 | $20,264 |
| Maximum | $70,046 | $94,379 |
| Range | $50,938 | $74,115 |
| Mean | $43,880 | $47,589 |
| Median | $42,360 | $47,756 |
| Interquartile 25% (IQ1) | $34,944 | $40,312 |
| Interquartile 75% (IQ3) | $53,629 | $53,919 |
| Interquartile Range (IQR) | $18,684 | $13,607 |
| Standard Deviation (Sample) | $12,658 | $13,819 |
| Standard Deviation (Population) | $12,514 | $13,587 |
Similar Demographics by Per Capita Income
Demographics Similar to Taiwanese by Per Capita Income
In terms of per capita income, the demographic groups most similar to Taiwanese are Chilean ($46,459, a difference of 0.010%), Immigrants from Morocco ($46,430, a difference of 0.050%), Immigrants from Albania ($46,387, a difference of 0.14%), Immigrants from Northern Africa ($46,531, a difference of 0.16%), and Immigrants from Kuwait ($46,543, a difference of 0.19%).
| Demographics | Rating | Rank | Per Capita Income |
| Brazilians | 96.8 /100 | #104 | Exceptional $46,700 |
| British | 96.3 /100 | #105 | Exceptional $46,571 |
| Ethiopians | 96.3 /100 | #106 | Exceptional $46,569 |
| Serbians | 96.2 /100 | #107 | Exceptional $46,551 |
| Immigrants | Kuwait | 96.2 /100 | #108 | Exceptional $46,543 |
| Immigrants | Northern Africa | 96.2 /100 | #109 | Exceptional $46,531 |
| Chileans | 95.9 /100 | #110 | Exceptional $46,459 |
| Taiwanese | 95.8 /100 | #111 | Exceptional $46,455 |
| Immigrants | Morocco | 95.7 /100 | #112 | Exceptional $46,430 |
| Immigrants | Albania | 95.5 /100 | #113 | Exceptional $46,387 |
| Afghans | 94.9 /100 | #114 | Exceptional $46,268 |
| Immigrants | Chile | 94.6 /100 | #115 | Exceptional $46,213 |
| Poles | 94.1 /100 | #116 | Exceptional $46,123 |
| Chinese | 93.9 /100 | #117 | Exceptional $46,098 |
| Immigrants | Saudi Arabia | 93.3 /100 | #118 | Exceptional $46,008 |
Demographics Similar to Immigrants from Italy by Per Capita Income
In terms of per capita income, the demographic groups most similar to Immigrants from Italy are Immigrants from Kazakhstan ($48,747, a difference of 0.19%), Immigrants from England ($48,844, a difference of 0.39%), Romanian ($48,445, a difference of 0.43%), Egyptian ($48,358, a difference of 0.61%), and Immigrants from Bolivia ($48,970, a difference of 0.65%).
| Demographics | Rating | Rank | Per Capita Income |
| Greeks | 99.8 /100 | #71 | Exceptional $49,309 |
| Immigrants | Hungary | 99.8 /100 | #72 | Exceptional $49,303 |
| Immigrants | North America | 99.8 /100 | #73 | Exceptional $49,302 |
| Mongolians | 99.8 /100 | #74 | Exceptional $49,173 |
| Immigrants | Bolivia | 99.7 /100 | #75 | Exceptional $48,970 |
| Immigrants | England | 99.7 /100 | #76 | Exceptional $48,844 |
| Immigrants | Kazakhstan | 99.7 /100 | #77 | Exceptional $48,747 |
| Immigrants | Italy | 99.6 /100 | #78 | Exceptional $48,654 |
| Romanians | 99.5 /100 | #79 | Exceptional $48,445 |
| Egyptians | 99.5 /100 | #80 | Exceptional $48,358 |
| Armenians | 99.4 /100 | #81 | Exceptional $48,287 |
| Immigrants | Indonesia | 99.4 /100 | #82 | Exceptional $48,195 |
| Immigrants | Brazil | 99.4 /100 | #83 | Exceptional $48,164 |
| Immigrants | Ukraine | 99.3 /100 | #84 | Exceptional $48,134 |
| Austrians | 99.3 /100 | #85 | Exceptional $48,116 |