Syrian vs Immigrants from Croatia Median Earnings
COMPARE
Syrian
Immigrants from Croatia
Median Earnings
Median Earnings Comparison
Syrians
Immigrants from Croatia
$48,934
MEDIAN EARNINGS
97.1/ 100
METRIC RATING
109th/ 347
METRIC RANK
$51,581
MEDIAN EARNINGS
99.9/ 100
METRIC RATING
59th/ 347
METRIC RANK
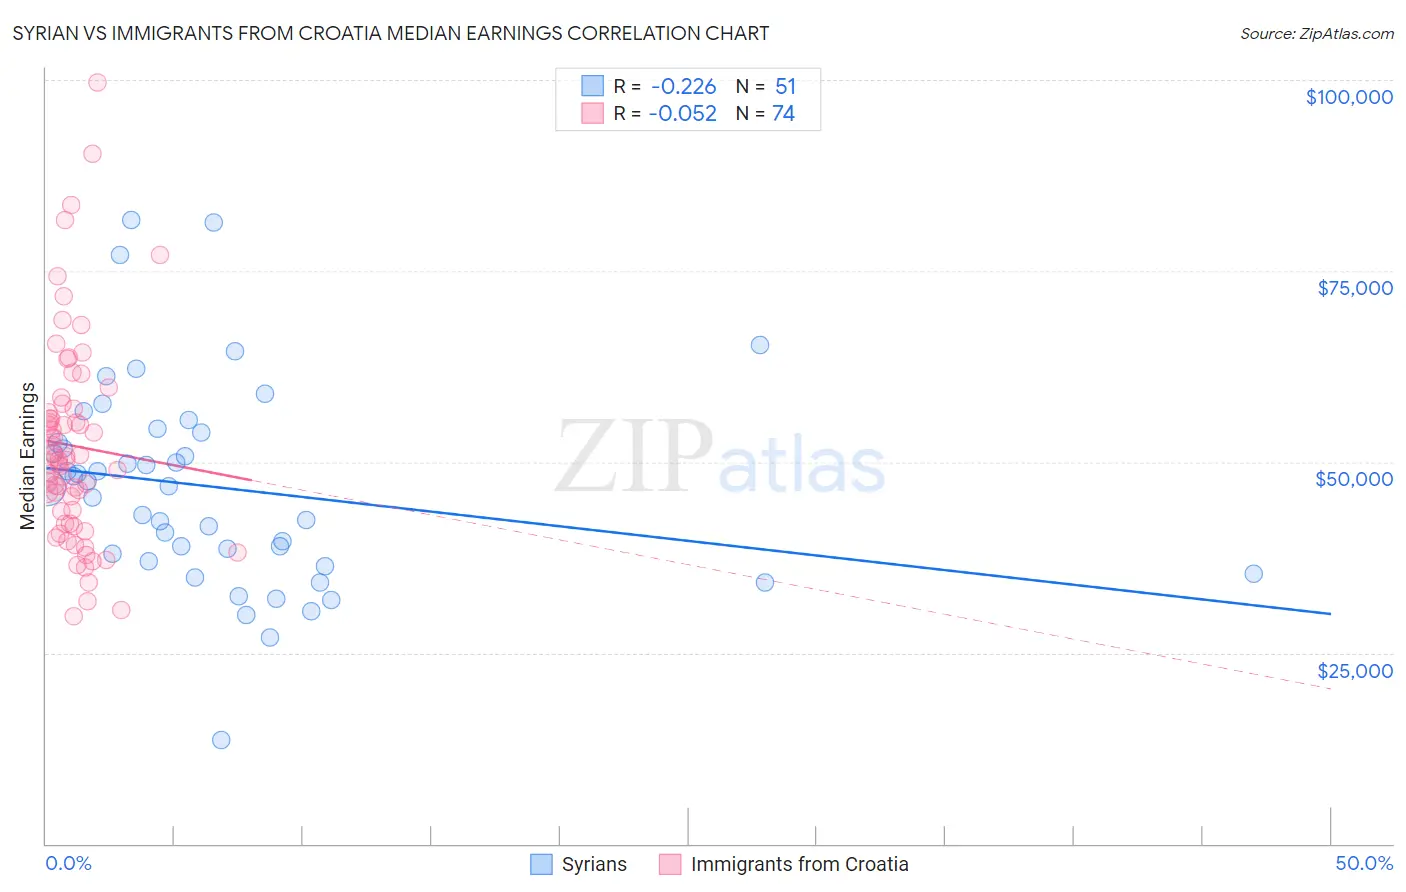
Syrian vs Immigrants from Croatia Median Earnings Correlation Chart
The statistical analysis conducted on geographies consisting of 266,312,508 people shows a weak negative correlation between the proportion of Syrians and median earnings in the United States with a correlation coefficient (R) of -0.226 and weighted average of $48,934. Similarly, the statistical analysis conducted on geographies consisting of 132,573,888 people shows a slight negative correlation between the proportion of Immigrants from Croatia and median earnings in the United States with a correlation coefficient (R) of -0.052 and weighted average of $51,581, a difference of 5.4%.
Median Earnings Correlation Summary
| Measurement | Syrian | Immigrants from Croatia |
| Minimum | $13,611 | $29,868 |
| Maximum | $81,610 | $99,706 |
| Range | $67,999 | $69,838 |
| Mean | $46,643 | $52,095 |
| Median | $46,804 | $50,253 |
| Interquartile 25% (IQ1) | $37,007 | $41,915 |
| Interquartile 75% (IQ3) | $53,802 | $56,902 |
| Interquartile Range (IQR) | $16,795 | $14,987 |
| Standard Deviation (Sample) | $13,425 | $13,541 |
| Standard Deviation (Population) | $13,293 | $13,449 |
Similar Demographics by Median Earnings
Demographics Similar to Syrians by Median Earnings
In terms of median earnings, the demographic groups most similar to Syrians are Immigrants from Ethiopia ($48,924, a difference of 0.020%), Immigrants from Zimbabwe ($48,913, a difference of 0.040%), Northern European ($48,887, a difference of 0.10%), Immigrants from Kuwait ($48,861, a difference of 0.15%), and Moroccan ($48,838, a difference of 0.20%).
| Demographics | Rating | Rank | Median Earnings |
| Ethiopians | 98.8 /100 | #102 | Exceptional $49,572 |
| Austrians | 98.7 /100 | #103 | Exceptional $49,501 |
| Immigrants | Brazil | 98.6 /100 | #104 | Exceptional $49,463 |
| Immigrants | Western Asia | 98.4 /100 | #105 | Exceptional $49,389 |
| Immigrants | Albania | 98.4 /100 | #106 | Exceptional $49,377 |
| Immigrants | Morocco | 98.4 /100 | #107 | Exceptional $49,368 |
| Palestinians | 98.0 /100 | #108 | Exceptional $49,209 |
| Syrians | 97.1 /100 | #109 | Exceptional $48,934 |
| Immigrants | Ethiopia | 97.1 /100 | #110 | Exceptional $48,924 |
| Immigrants | Zimbabwe | 97.0 /100 | #111 | Exceptional $48,913 |
| Northern Europeans | 96.9 /100 | #112 | Exceptional $48,887 |
| Immigrants | Kuwait | 96.8 /100 | #113 | Exceptional $48,861 |
| Moroccans | 96.7 /100 | #114 | Exceptional $48,838 |
| Chinese | 96.7 /100 | #115 | Exceptional $48,836 |
| Koreans | 96.2 /100 | #116 | Exceptional $48,727 |
Demographics Similar to Immigrants from Croatia by Median Earnings
In terms of median earnings, the demographic groups most similar to Immigrants from Croatia are Immigrants from Bolivia ($51,605, a difference of 0.050%), Immigrants from Serbia ($51,557, a difference of 0.050%), Immigrants from Latvia ($51,555, a difference of 0.050%), Immigrants from Eastern Europe ($51,624, a difference of 0.080%), and Immigrants from Pakistan ($51,693, a difference of 0.22%).
| Demographics | Rating | Rank | Median Earnings |
| Estonians | 99.9 /100 | #52 | Exceptional $51,772 |
| Immigrants | Norway | 99.9 /100 | #53 | Exceptional $51,758 |
| Immigrants | Indonesia | 99.9 /100 | #54 | Exceptional $51,715 |
| Egyptians | 99.9 /100 | #55 | Exceptional $51,701 |
| Immigrants | Pakistan | 99.9 /100 | #56 | Exceptional $51,693 |
| Immigrants | Eastern Europe | 99.9 /100 | #57 | Exceptional $51,624 |
| Immigrants | Bolivia | 99.9 /100 | #58 | Exceptional $51,605 |
| Immigrants | Croatia | 99.9 /100 | #59 | Exceptional $51,581 |
| Immigrants | Serbia | 99.9 /100 | #60 | Exceptional $51,557 |
| Immigrants | Latvia | 99.9 /100 | #61 | Exceptional $51,555 |
| Immigrants | Romania | 99.9 /100 | #62 | Exceptional $51,337 |
| Immigrants | Bulgaria | 99.9 /100 | #63 | Exceptional $51,318 |
| New Zealanders | 99.9 /100 | #64 | Exceptional $51,246 |
| Greeks | 99.9 /100 | #65 | Exceptional $51,164 |
| Afghans | 99.9 /100 | #66 | Exceptional $51,112 |