Syrian vs West Indian Median Earnings
COMPARE
Syrian
West Indian
Median Earnings
Median Earnings Comparison
Syrians
West Indians
$48,934
MEDIAN EARNINGS
97.1/ 100
METRIC RATING
109th/ 347
METRIC RANK
$45,132
MEDIAN EARNINGS
13.9/ 100
METRIC RATING
224th/ 347
METRIC RANK
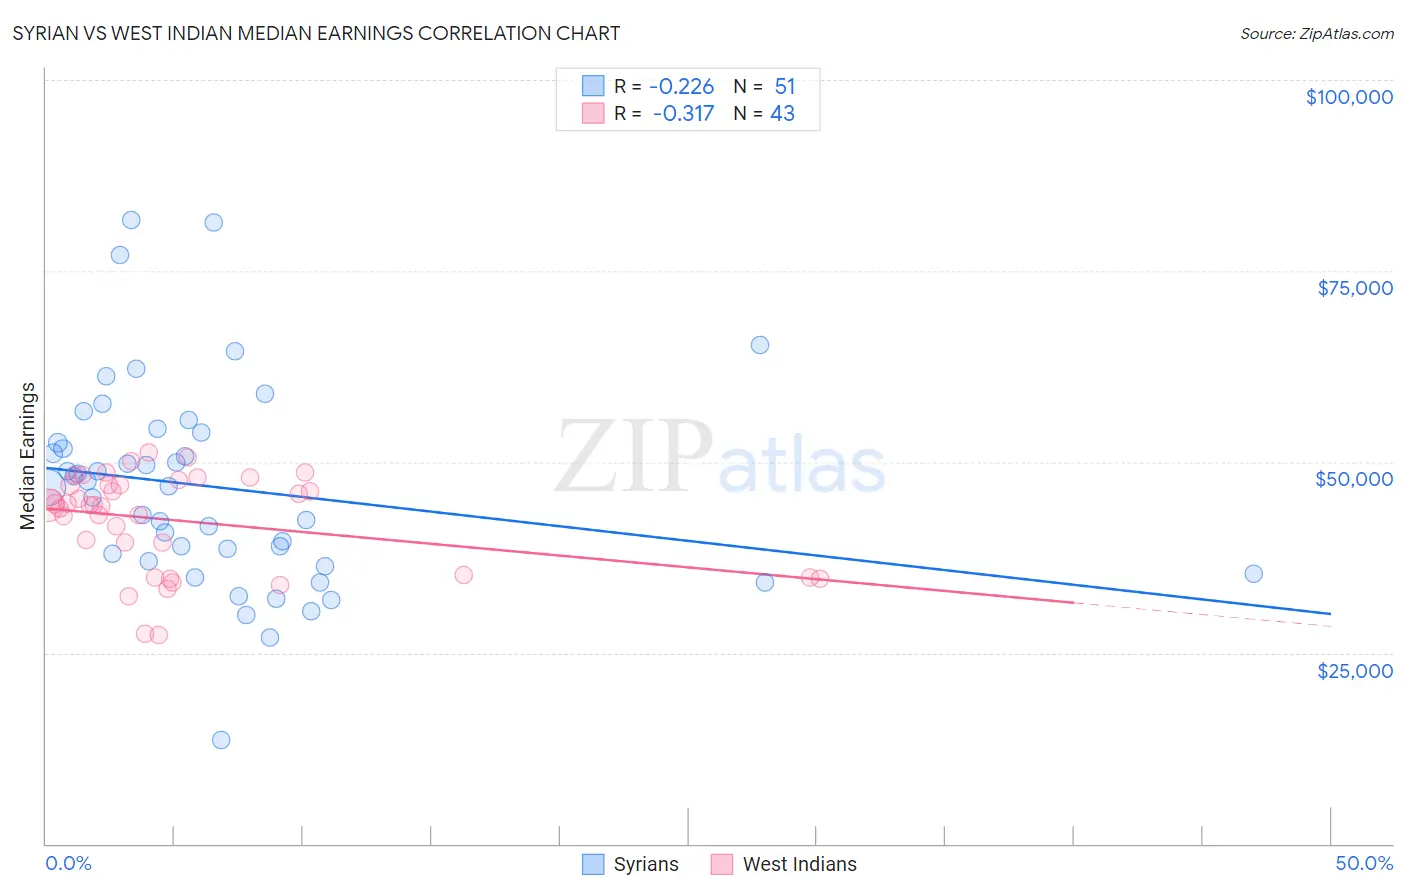
Syrian vs West Indian Median Earnings Correlation Chart
The statistical analysis conducted on geographies consisting of 266,312,508 people shows a weak negative correlation between the proportion of Syrians and median earnings in the United States with a correlation coefficient (R) of -0.226 and weighted average of $48,934. Similarly, the statistical analysis conducted on geographies consisting of 254,045,468 people shows a mild negative correlation between the proportion of West Indians and median earnings in the United States with a correlation coefficient (R) of -0.317 and weighted average of $45,132, a difference of 8.4%.
Median Earnings Correlation Summary
| Measurement | Syrian | West Indian |
| Minimum | $13,611 | $27,409 |
| Maximum | $81,610 | $51,215 |
| Range | $67,999 | $23,806 |
| Mean | $46,643 | $42,337 |
| Median | $46,804 | $44,343 |
| Interquartile 25% (IQ1) | $37,007 | $35,256 |
| Interquartile 75% (IQ3) | $53,802 | $47,046 |
| Interquartile Range (IQR) | $16,795 | $11,790 |
| Standard Deviation (Sample) | $13,425 | $6,289 |
| Standard Deviation (Population) | $13,293 | $6,215 |
Similar Demographics by Median Earnings
Demographics Similar to Syrians by Median Earnings
In terms of median earnings, the demographic groups most similar to Syrians are Immigrants from Ethiopia ($48,924, a difference of 0.020%), Immigrants from Zimbabwe ($48,913, a difference of 0.040%), Northern European ($48,887, a difference of 0.10%), Immigrants from Kuwait ($48,861, a difference of 0.15%), and Moroccan ($48,838, a difference of 0.20%).
| Demographics | Rating | Rank | Median Earnings |
| Ethiopians | 98.8 /100 | #102 | Exceptional $49,572 |
| Austrians | 98.7 /100 | #103 | Exceptional $49,501 |
| Immigrants | Brazil | 98.6 /100 | #104 | Exceptional $49,463 |
| Immigrants | Western Asia | 98.4 /100 | #105 | Exceptional $49,389 |
| Immigrants | Albania | 98.4 /100 | #106 | Exceptional $49,377 |
| Immigrants | Morocco | 98.4 /100 | #107 | Exceptional $49,368 |
| Palestinians | 98.0 /100 | #108 | Exceptional $49,209 |
| Syrians | 97.1 /100 | #109 | Exceptional $48,934 |
| Immigrants | Ethiopia | 97.1 /100 | #110 | Exceptional $48,924 |
| Immigrants | Zimbabwe | 97.0 /100 | #111 | Exceptional $48,913 |
| Northern Europeans | 96.9 /100 | #112 | Exceptional $48,887 |
| Immigrants | Kuwait | 96.8 /100 | #113 | Exceptional $48,861 |
| Moroccans | 96.7 /100 | #114 | Exceptional $48,838 |
| Chinese | 96.7 /100 | #115 | Exceptional $48,836 |
| Koreans | 96.2 /100 | #116 | Exceptional $48,727 |
Demographics Similar to West Indians by Median Earnings
In terms of median earnings, the demographic groups most similar to West Indians are Immigrants from Cambodia ($45,090, a difference of 0.090%), Immigrants from Panama ($45,198, a difference of 0.15%), White/Caucasian ($45,197, a difference of 0.15%), Immigrants from Guyana ($45,204, a difference of 0.16%), and Ecuadorian ($45,214, a difference of 0.18%).
| Demographics | Rating | Rank | Median Earnings |
| Tlingit-Haida | 20.5 /100 | #217 | Fair $45,468 |
| Spanish | 19.7 /100 | #218 | Poor $45,432 |
| Dutch | 18.4 /100 | #219 | Poor $45,370 |
| Ecuadorians | 15.3 /100 | #220 | Poor $45,214 |
| Immigrants | Guyana | 15.1 /100 | #221 | Poor $45,204 |
| Immigrants | Panama | 15.0 /100 | #222 | Poor $45,198 |
| Whites/Caucasians | 15.0 /100 | #223 | Poor $45,197 |
| West Indians | 13.9 /100 | #224 | Poor $45,132 |
| Immigrants | Cambodia | 13.2 /100 | #225 | Poor $45,090 |
| Immigrants | Nigeria | 12.2 /100 | #226 | Poor $45,030 |
| Native Hawaiians | 12.2 /100 | #227 | Poor $45,027 |
| Immigrants | Iraq | 11.6 /100 | #228 | Poor $44,988 |
| Scotch-Irish | 10.7 /100 | #229 | Poor $44,924 |
| Immigrants | Western Africa | 10.3 /100 | #230 | Poor $44,893 |
| Japanese | 9.5 /100 | #231 | Tragic $44,825 |