Syrian vs Immigrants from India Median Male Earnings
COMPARE
Syrian
Immigrants from India
Median Male Earnings
Median Male Earnings Comparison
Syrians
Immigrants from India
$58,187
MEDIAN MALE EARNINGS
97.4/ 100
METRIC RATING
102nd/ 347
METRIC RANK
$74,207
MEDIAN MALE EARNINGS
100.0/ 100
METRIC RATING
2nd/ 347
METRIC RANK
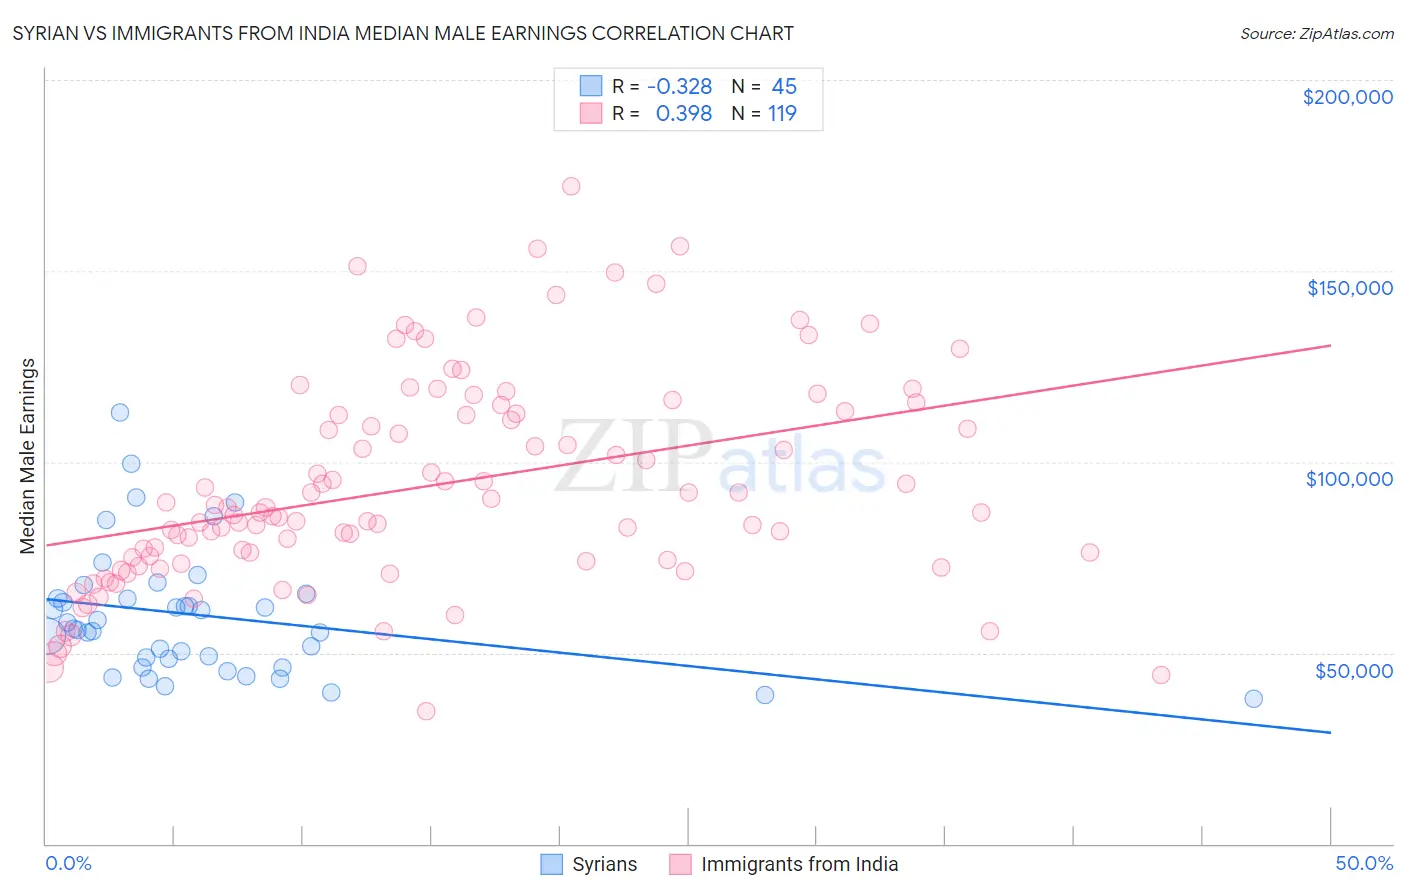
Syrian vs Immigrants from India Median Male Earnings Correlation Chart
The statistical analysis conducted on geographies consisting of 266,273,099 people shows a mild negative correlation between the proportion of Syrians and median male earnings in the United States with a correlation coefficient (R) of -0.328 and weighted average of $58,187. Similarly, the statistical analysis conducted on geographies consisting of 434,025,837 people shows a mild positive correlation between the proportion of Immigrants from India and median male earnings in the United States with a correlation coefficient (R) of 0.398 and weighted average of $74,207, a difference of 27.5%.
Median Male Earnings Correlation Summary
| Measurement | Syrian | Immigrants from India |
| Minimum | $38,125 | $34,783 |
| Maximum | $112,858 | $172,259 |
| Range | $74,733 | $137,476 |
| Mean | $59,779 | $93,517 |
| Median | $56,452 | $86,905 |
| Interquartile 25% (IQ1) | $47,297 | $74,008 |
| Interquartile 75% (IQ3) | $64,910 | $112,721 |
| Interquartile Range (IQR) | $17,614 | $38,713 |
| Standard Deviation (Sample) | $16,573 | $27,317 |
| Standard Deviation (Population) | $16,388 | $27,202 |
Similar Demographics by Median Male Earnings
Demographics Similar to Syrians by Median Male Earnings
In terms of median male earnings, the demographic groups most similar to Syrians are Polish ($58,139, a difference of 0.080%), Armenian ($58,134, a difference of 0.090%), Immigrants from Western Asia ($58,131, a difference of 0.10%), Immigrants from Brazil ($58,324, a difference of 0.24%), and Immigrants from Northern Africa ($58,008, a difference of 0.31%).
| Demographics | Rating | Rank | Median Male Earnings |
| Immigrants | Lebanon | 98.6 /100 | #95 | Exceptional $58,835 |
| Albanians | 98.4 /100 | #96 | Exceptional $58,680 |
| Northern Europeans | 98.2 /100 | #97 | Exceptional $58,588 |
| Jordanians | 98.1 /100 | #98 | Exceptional $58,500 |
| Immigrants | Poland | 98.0 /100 | #99 | Exceptional $58,452 |
| Assyrians/Chaldeans/Syriacs | 97.9 /100 | #100 | Exceptional $58,437 |
| Immigrants | Brazil | 97.7 /100 | #101 | Exceptional $58,324 |
| Syrians | 97.4 /100 | #102 | Exceptional $58,187 |
| Poles | 97.3 /100 | #103 | Exceptional $58,139 |
| Armenians | 97.3 /100 | #104 | Exceptional $58,134 |
| Immigrants | Western Asia | 97.3 /100 | #105 | Exceptional $58,131 |
| Immigrants | Northern Africa | 96.9 /100 | #106 | Exceptional $58,008 |
| Serbians | 96.8 /100 | #107 | Exceptional $57,975 |
| Immigrants | Uzbekistan | 96.7 /100 | #108 | Exceptional $57,941 |
| British | 96.5 /100 | #109 | Exceptional $57,890 |
Demographics Similar to Immigrants from India by Median Male Earnings
In terms of median male earnings, the demographic groups most similar to Immigrants from India are Filipino ($74,224, a difference of 0.020%), Immigrants from Taiwan ($74,031, a difference of 0.24%), Thai ($72,135, a difference of 2.9%), Immigrants from Singapore ($71,348, a difference of 4.0%), and Iranian ($70,648, a difference of 5.0%).
| Demographics | Rating | Rank | Median Male Earnings |
| Filipinos | 100.0 /100 | #1 | Exceptional $74,224 |
| Immigrants | India | 100.0 /100 | #2 | Exceptional $74,207 |
| Immigrants | Taiwan | 100.0 /100 | #3 | Exceptional $74,031 |
| Thais | 100.0 /100 | #4 | Exceptional $72,135 |
| Immigrants | Singapore | 100.0 /100 | #5 | Exceptional $71,348 |
| Iranians | 100.0 /100 | #6 | Exceptional $70,648 |
| Immigrants | Hong Kong | 100.0 /100 | #7 | Exceptional $70,146 |
| Immigrants | Iran | 100.0 /100 | #8 | Exceptional $69,284 |
| Immigrants | South Central Asia | 100.0 /100 | #9 | Exceptional $68,960 |
| Immigrants | Israel | 100.0 /100 | #10 | Exceptional $68,716 |
| Immigrants | Ireland | 100.0 /100 | #11 | Exceptional $67,698 |
| Immigrants | Australia | 100.0 /100 | #12 | Exceptional $67,634 |
| Immigrants | China | 100.0 /100 | #13 | Exceptional $67,353 |
| Okinawans | 100.0 /100 | #14 | Exceptional $67,232 |
| Immigrants | Eastern Asia | 100.0 /100 | #15 | Exceptional $66,903 |