Syrian vs Immigrants from India In Labor Force | Age 30-34
COMPARE
Syrian
Immigrants from India
In Labor Force | Age 30-34
In Labor Force | Age 30-34 Comparison
Syrians
Immigrants from India
84.8%
IN LABOR FORCE | AGE 30-34
70.1/ 100
METRIC RATING
153rd/ 347
METRIC RANK
85.2%
IN LABOR FORCE | AGE 30-34
97.4/ 100
METRIC RATING
95th/ 347
METRIC RANK
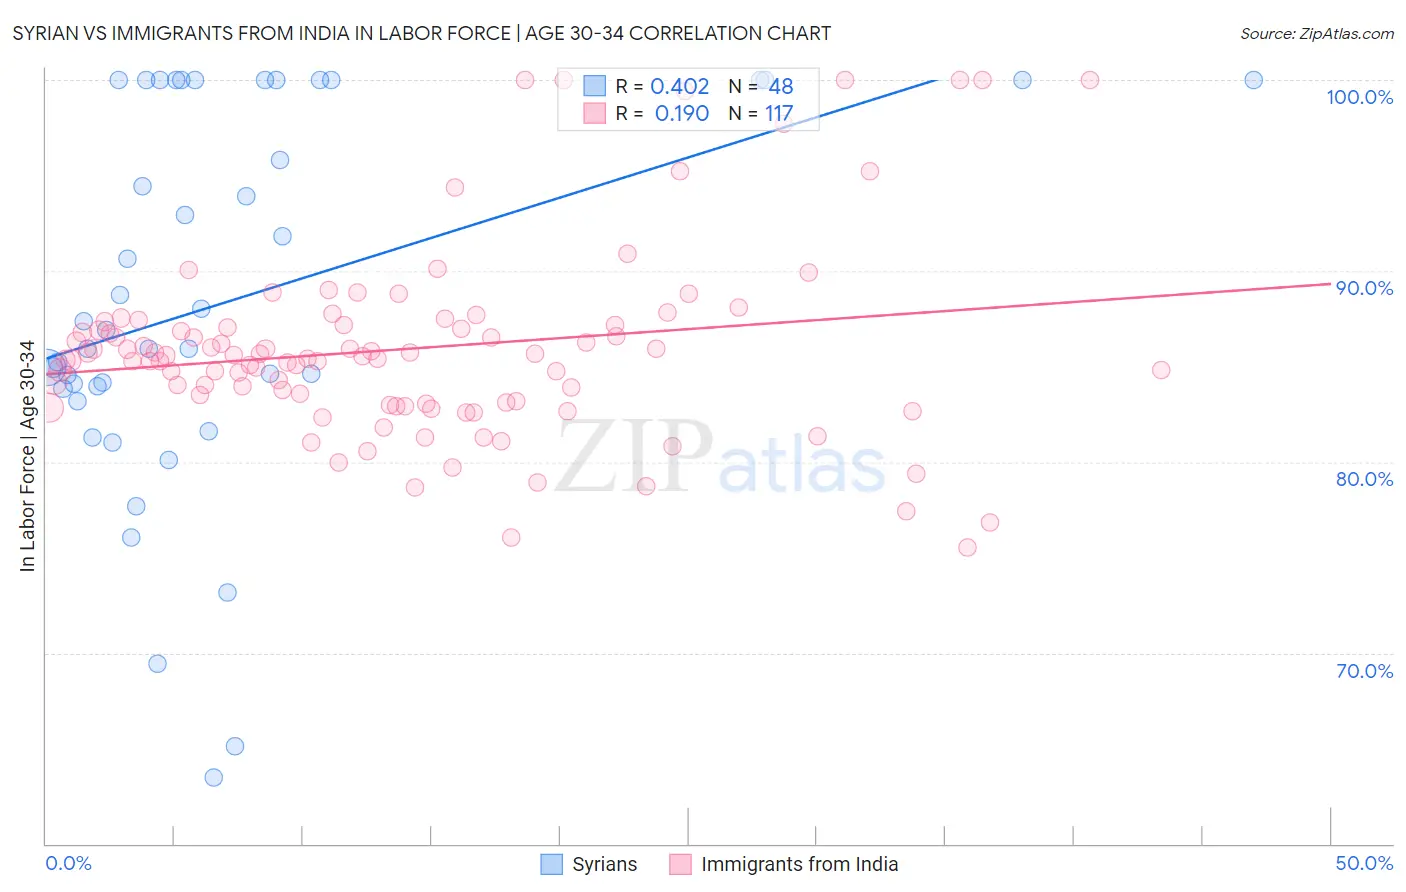
Syrian vs Immigrants from India In Labor Force | Age 30-34 Correlation Chart
The statistical analysis conducted on geographies consisting of 266,193,214 people shows a moderate positive correlation between the proportion of Syrians and labor force participation rate among population between the ages 30 and 34 in the United States with a correlation coefficient (R) of 0.402 and weighted average of 84.8%. Similarly, the statistical analysis conducted on geographies consisting of 433,763,209 people shows a poor positive correlation between the proportion of Immigrants from India and labor force participation rate among population between the ages 30 and 34 in the United States with a correlation coefficient (R) of 0.190 and weighted average of 85.2%, a difference of 0.49%.
In Labor Force | Age 30-34 Correlation Summary
| Measurement | Syrian | Immigrants from India |
| Minimum | 63.5% | 75.5% |
| Maximum | 100.0% | 100.0% |
| Range | 36.5% | 24.5% |
| Mean | 88.4% | 85.9% |
| Median | 86.4% | 85.5% |
| Interquartile 25% (IQ1) | 83.9% | 83.1% |
| Interquartile 75% (IQ3) | 100.0% | 87.2% |
| Interquartile Range (IQR) | 16.1% | 4.1% |
| Standard Deviation (Sample) | 9.8% | 5.0% |
| Standard Deviation (Population) | 9.7% | 5.0% |
Similar Demographics by In Labor Force | Age 30-34
Demographics Similar to Syrians by In Labor Force | Age 30-34
In terms of in labor force | age 30-34, the demographic groups most similar to Syrians are Northern European (84.8%, a difference of 0.0%), Immigrants from Sudan (84.8%, a difference of 0.0%), French Canadian (84.8%, a difference of 0.020%), Immigrants from Senegal (84.8%, a difference of 0.030%), and Romanian (84.8%, a difference of 0.030%).
| Demographics | Rating | Rank | In Labor Force | Age 30-34 |
| Immigrants | Saudi Arabia | 76.6 /100 | #146 | Good 84.9% |
| Immigrants | Colombia | 76.3 /100 | #147 | Good 84.9% |
| Immigrants | Pakistan | 76.2 /100 | #148 | Good 84.9% |
| Immigrants | Ukraine | 75.1 /100 | #149 | Good 84.8% |
| Germans | 75.1 /100 | #150 | Good 84.8% |
| Immigrants | Senegal | 74.0 /100 | #151 | Good 84.8% |
| Romanians | 73.5 /100 | #152 | Good 84.8% |
| Syrians | 70.1 /100 | #153 | Good 84.8% |
| Northern Europeans | 70.0 /100 | #154 | Good 84.8% |
| Immigrants | Sudan | 69.5 /100 | #155 | Good 84.8% |
| French Canadians | 67.3 /100 | #156 | Good 84.8% |
| Peruvians | 65.9 /100 | #157 | Good 84.8% |
| Immigrants | Armenia | 64.7 /100 | #158 | Good 84.8% |
| Czechoslovakians | 63.0 /100 | #159 | Good 84.8% |
| Pakistanis | 60.8 /100 | #160 | Good 84.7% |
Demographics Similar to Immigrants from India by In Labor Force | Age 30-34
In terms of in labor force | age 30-34, the demographic groups most similar to Immigrants from India are Swedish (85.2%, a difference of 0.0%), Immigrants from Norway (85.2%, a difference of 0.010%), Immigrants from Korea (85.2%, a difference of 0.010%), Thai (85.2%, a difference of 0.010%), and German Russian (85.2%, a difference of 0.020%).
| Demographics | Rating | Rank | In Labor Force | Age 30-34 |
| Immigrants | Belgium | 98.2 /100 | #88 | Exceptional 85.3% |
| Immigrants | Kazakhstan | 98.1 /100 | #89 | Exceptional 85.3% |
| Burmese | 97.9 /100 | #90 | Exceptional 85.3% |
| Immigrants | Moldova | 97.9 /100 | #91 | Exceptional 85.3% |
| German Russians | 97.7 /100 | #92 | Exceptional 85.2% |
| Immigrants | Norway | 97.6 /100 | #93 | Exceptional 85.2% |
| Swedes | 97.5 /100 | #94 | Exceptional 85.2% |
| Immigrants | India | 97.4 /100 | #95 | Exceptional 85.2% |
| Immigrants | Korea | 97.3 /100 | #96 | Exceptional 85.2% |
| Thais | 97.2 /100 | #97 | Exceptional 85.2% |
| Immigrants | Uganda | 97.2 /100 | #98 | Exceptional 85.2% |
| Belgians | 97.2 /100 | #99 | Exceptional 85.2% |
| Sudanese | 97.1 /100 | #100 | Exceptional 85.2% |
| Immigrants | Belarus | 96.9 /100 | #101 | Exceptional 85.2% |
| Immigrants | Austria | 96.8 /100 | #102 | Exceptional 85.2% |