Immigrants from Poland vs Immigrants from India Median Male Earnings
COMPARE
Immigrants from Poland
Immigrants from India
Median Male Earnings
Median Male Earnings Comparison
Immigrants from Poland
Immigrants from India
$58,452
MEDIAN MALE EARNINGS
98.0/ 100
METRIC RATING
99th/ 347
METRIC RANK
$74,207
MEDIAN MALE EARNINGS
100.0/ 100
METRIC RATING
2nd/ 347
METRIC RANK
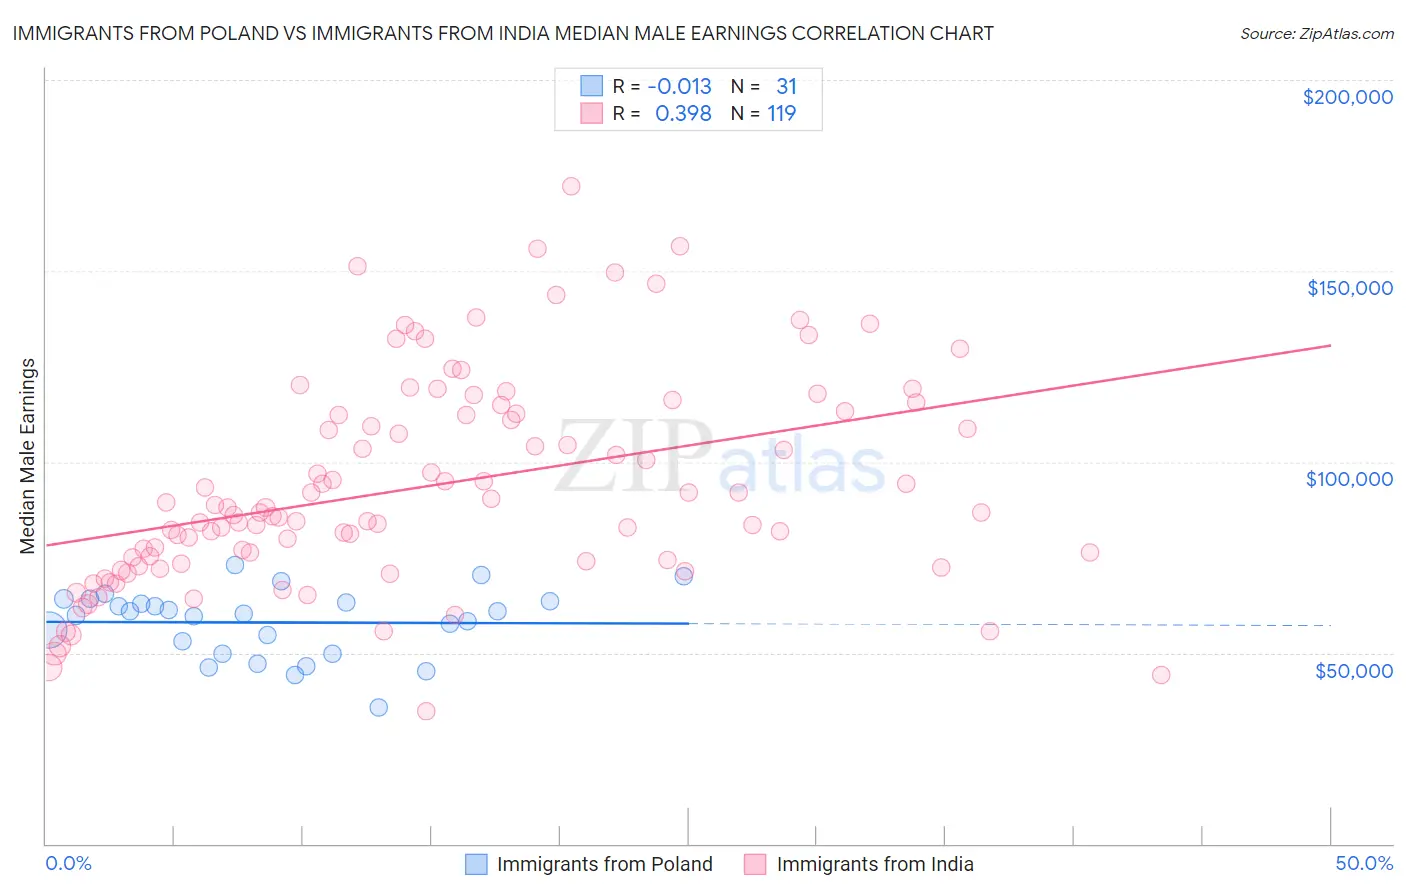
Immigrants from Poland vs Immigrants from India Median Male Earnings Correlation Chart
The statistical analysis conducted on geographies consisting of 304,780,508 people shows no correlation between the proportion of Immigrants from Poland and median male earnings in the United States with a correlation coefficient (R) of -0.013 and weighted average of $58,452. Similarly, the statistical analysis conducted on geographies consisting of 434,025,837 people shows a mild positive correlation between the proportion of Immigrants from India and median male earnings in the United States with a correlation coefficient (R) of 0.398 and weighted average of $74,207, a difference of 27.0%.
Median Male Earnings Correlation Summary
| Measurement | Immigrants from Poland | Immigrants from India |
| Minimum | $35,574 | $34,783 |
| Maximum | $73,128 | $172,259 |
| Range | $37,554 | $137,476 |
| Mean | $57,933 | $93,517 |
| Median | $60,075 | $86,905 |
| Interquartile 25% (IQ1) | $49,798 | $74,008 |
| Interquartile 75% (IQ3) | $63,413 | $112,721 |
| Interquartile Range (IQR) | $13,615 | $38,713 |
| Standard Deviation (Sample) | $8,867 | $27,317 |
| Standard Deviation (Population) | $8,722 | $27,202 |
Similar Demographics by Median Male Earnings
Demographics Similar to Immigrants from Poland by Median Male Earnings
In terms of median male earnings, the demographic groups most similar to Immigrants from Poland are Assyrian/Chaldean/Syriac ($58,437, a difference of 0.030%), Jordanian ($58,500, a difference of 0.080%), Immigrants from Brazil ($58,324, a difference of 0.22%), Northern European ($58,588, a difference of 0.23%), and Albanian ($58,680, a difference of 0.39%).
| Demographics | Rating | Rank | Median Male Earnings |
| Immigrants | Kazakhstan | 99.1 /100 | #92 | Exceptional $59,278 |
| Immigrants | Southern Europe | 99.0 /100 | #93 | Exceptional $59,217 |
| Immigrants | North Macedonia | 99.0 /100 | #94 | Exceptional $59,189 |
| Immigrants | Lebanon | 98.6 /100 | #95 | Exceptional $58,835 |
| Albanians | 98.4 /100 | #96 | Exceptional $58,680 |
| Northern Europeans | 98.2 /100 | #97 | Exceptional $58,588 |
| Jordanians | 98.1 /100 | #98 | Exceptional $58,500 |
| Immigrants | Poland | 98.0 /100 | #99 | Exceptional $58,452 |
| Assyrians/Chaldeans/Syriacs | 97.9 /100 | #100 | Exceptional $58,437 |
| Immigrants | Brazil | 97.7 /100 | #101 | Exceptional $58,324 |
| Syrians | 97.4 /100 | #102 | Exceptional $58,187 |
| Poles | 97.3 /100 | #103 | Exceptional $58,139 |
| Armenians | 97.3 /100 | #104 | Exceptional $58,134 |
| Immigrants | Western Asia | 97.3 /100 | #105 | Exceptional $58,131 |
| Immigrants | Northern Africa | 96.9 /100 | #106 | Exceptional $58,008 |
Demographics Similar to Immigrants from India by Median Male Earnings
In terms of median male earnings, the demographic groups most similar to Immigrants from India are Filipino ($74,224, a difference of 0.020%), Immigrants from Taiwan ($74,031, a difference of 0.24%), Thai ($72,135, a difference of 2.9%), Immigrants from Singapore ($71,348, a difference of 4.0%), and Iranian ($70,648, a difference of 5.0%).
| Demographics | Rating | Rank | Median Male Earnings |
| Filipinos | 100.0 /100 | #1 | Exceptional $74,224 |
| Immigrants | India | 100.0 /100 | #2 | Exceptional $74,207 |
| Immigrants | Taiwan | 100.0 /100 | #3 | Exceptional $74,031 |
| Thais | 100.0 /100 | #4 | Exceptional $72,135 |
| Immigrants | Singapore | 100.0 /100 | #5 | Exceptional $71,348 |
| Iranians | 100.0 /100 | #6 | Exceptional $70,648 |
| Immigrants | Hong Kong | 100.0 /100 | #7 | Exceptional $70,146 |
| Immigrants | Iran | 100.0 /100 | #8 | Exceptional $69,284 |
| Immigrants | South Central Asia | 100.0 /100 | #9 | Exceptional $68,960 |
| Immigrants | Israel | 100.0 /100 | #10 | Exceptional $68,716 |
| Immigrants | Ireland | 100.0 /100 | #11 | Exceptional $67,698 |
| Immigrants | Australia | 100.0 /100 | #12 | Exceptional $67,634 |
| Immigrants | China | 100.0 /100 | #13 | Exceptional $67,353 |
| Okinawans | 100.0 /100 | #14 | Exceptional $67,232 |
| Immigrants | Eastern Asia | 100.0 /100 | #15 | Exceptional $66,903 |