Ottawa vs Immigrants from India Median Male Earnings
COMPARE
Ottawa
Immigrants from India
Median Male Earnings
Median Male Earnings Comparison
Ottawa
Immigrants from India
$46,611
MEDIAN MALE EARNINGS
0.0/ 100
METRIC RATING
308th/ 347
METRIC RANK
$74,207
MEDIAN MALE EARNINGS
100.0/ 100
METRIC RATING
2nd/ 347
METRIC RANK
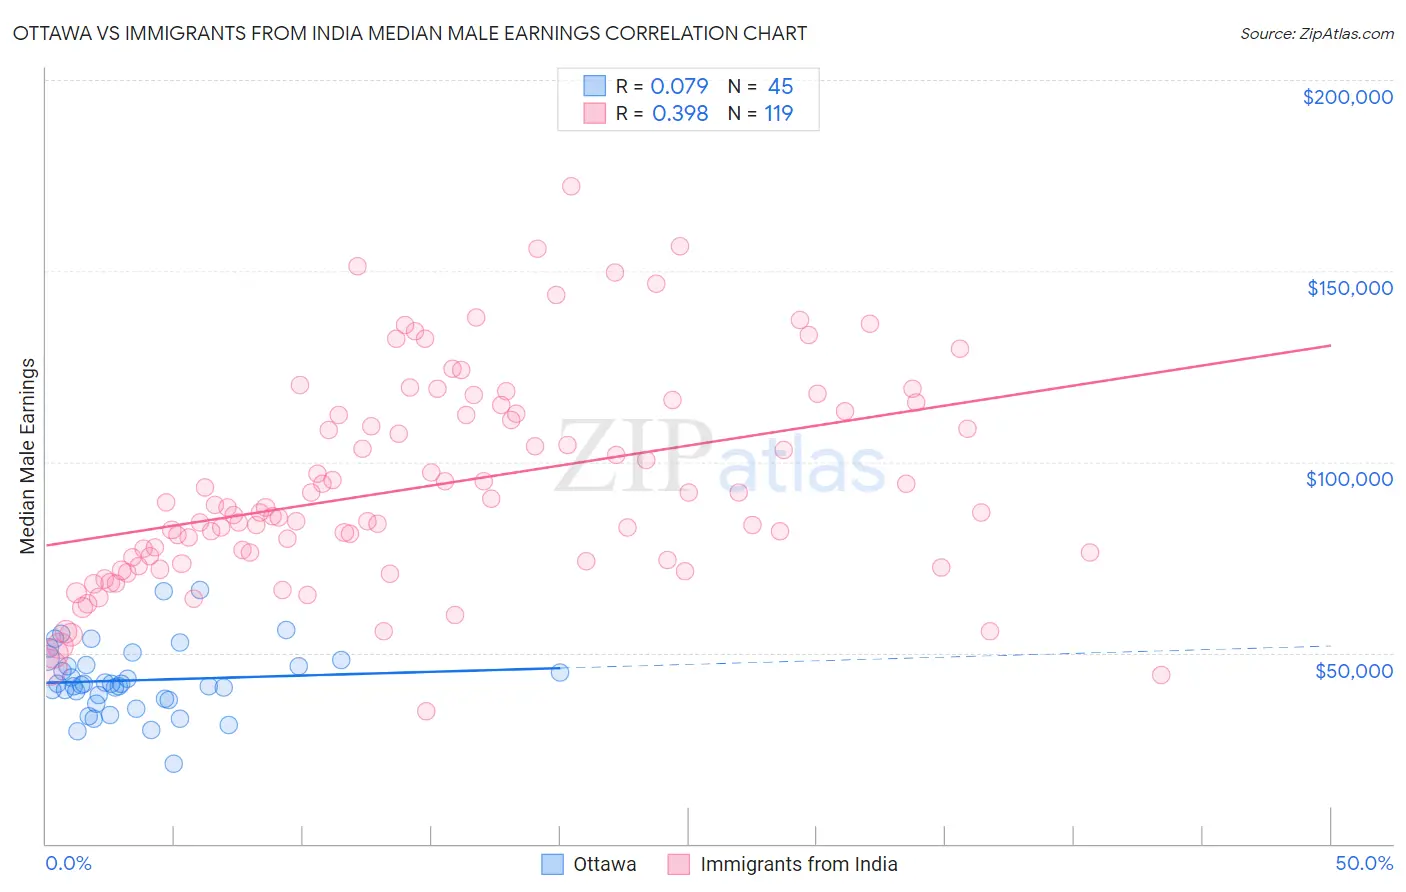
Ottawa vs Immigrants from India Median Male Earnings Correlation Chart
The statistical analysis conducted on geographies consisting of 49,954,818 people shows a slight positive correlation between the proportion of Ottawa and median male earnings in the United States with a correlation coefficient (R) of 0.079 and weighted average of $46,611. Similarly, the statistical analysis conducted on geographies consisting of 434,025,837 people shows a mild positive correlation between the proportion of Immigrants from India and median male earnings in the United States with a correlation coefficient (R) of 0.398 and weighted average of $74,207, a difference of 59.2%.
Median Male Earnings Correlation Summary
| Measurement | Ottawa | Immigrants from India |
| Minimum | $20,938 | $34,783 |
| Maximum | $66,563 | $172,259 |
| Range | $45,625 | $137,476 |
| Mean | $42,823 | $93,517 |
| Median | $41,768 | $86,905 |
| Interquartile 25% (IQ1) | $37,908 | $74,008 |
| Interquartile 75% (IQ3) | $47,441 | $112,721 |
| Interquartile Range (IQR) | $9,533 | $38,713 |
| Standard Deviation (Sample) | $8,970 | $27,317 |
| Standard Deviation (Population) | $8,870 | $27,202 |
Similar Demographics by Median Male Earnings
Demographics Similar to Ottawa by Median Male Earnings
In terms of median male earnings, the demographic groups most similar to Ottawa are Creek ($46,594, a difference of 0.040%), Cuban ($46,580, a difference of 0.070%), Immigrants from Dominican Republic ($46,655, a difference of 0.090%), Dutch West Indian ($46,656, a difference of 0.10%), and Guatemalan ($46,736, a difference of 0.27%).
| Demographics | Rating | Rank | Median Male Earnings |
| Immigrants | Latin America | 0.1 /100 | #301 | Tragic $46,941 |
| Seminole | 0.1 /100 | #302 | Tragic $46,783 |
| Yaqui | 0.1 /100 | #303 | Tragic $46,777 |
| Bangladeshis | 0.1 /100 | #304 | Tragic $46,744 |
| Guatemalans | 0.0 /100 | #305 | Tragic $46,736 |
| Dutch West Indians | 0.0 /100 | #306 | Tragic $46,656 |
| Immigrants | Dominican Republic | 0.0 /100 | #307 | Tragic $46,655 |
| Ottawa | 0.0 /100 | #308 | Tragic $46,611 |
| Creek | 0.0 /100 | #309 | Tragic $46,594 |
| Cubans | 0.0 /100 | #310 | Tragic $46,580 |
| Apache | 0.0 /100 | #311 | Tragic $46,429 |
| Hispanics or Latinos | 0.0 /100 | #312 | Tragic $46,419 |
| Hondurans | 0.0 /100 | #313 | Tragic $46,374 |
| Chippewa | 0.0 /100 | #314 | Tragic $46,368 |
| Immigrants | Guatemala | 0.0 /100 | #315 | Tragic $46,244 |
Demographics Similar to Immigrants from India by Median Male Earnings
In terms of median male earnings, the demographic groups most similar to Immigrants from India are Filipino ($74,224, a difference of 0.020%), Immigrants from Taiwan ($74,031, a difference of 0.24%), Thai ($72,135, a difference of 2.9%), Immigrants from Singapore ($71,348, a difference of 4.0%), and Iranian ($70,648, a difference of 5.0%).
| Demographics | Rating | Rank | Median Male Earnings |
| Filipinos | 100.0 /100 | #1 | Exceptional $74,224 |
| Immigrants | India | 100.0 /100 | #2 | Exceptional $74,207 |
| Immigrants | Taiwan | 100.0 /100 | #3 | Exceptional $74,031 |
| Thais | 100.0 /100 | #4 | Exceptional $72,135 |
| Immigrants | Singapore | 100.0 /100 | #5 | Exceptional $71,348 |
| Iranians | 100.0 /100 | #6 | Exceptional $70,648 |
| Immigrants | Hong Kong | 100.0 /100 | #7 | Exceptional $70,146 |
| Immigrants | Iran | 100.0 /100 | #8 | Exceptional $69,284 |
| Immigrants | South Central Asia | 100.0 /100 | #9 | Exceptional $68,960 |
| Immigrants | Israel | 100.0 /100 | #10 | Exceptional $68,716 |
| Immigrants | Ireland | 100.0 /100 | #11 | Exceptional $67,698 |
| Immigrants | Australia | 100.0 /100 | #12 | Exceptional $67,634 |
| Immigrants | China | 100.0 /100 | #13 | Exceptional $67,353 |
| Okinawans | 100.0 /100 | #14 | Exceptional $67,232 |
| Immigrants | Eastern Asia | 100.0 /100 | #15 | Exceptional $66,903 |