Syrian vs Jordanian Median Male Earnings
COMPARE
Syrian
Jordanian
Median Male Earnings
Median Male Earnings Comparison
Syrians
Jordanians
$58,187
MEDIAN MALE EARNINGS
97.4/ 100
METRIC RATING
102nd/ 347
METRIC RANK
$58,500
MEDIAN MALE EARNINGS
98.1/ 100
METRIC RATING
98th/ 347
METRIC RANK
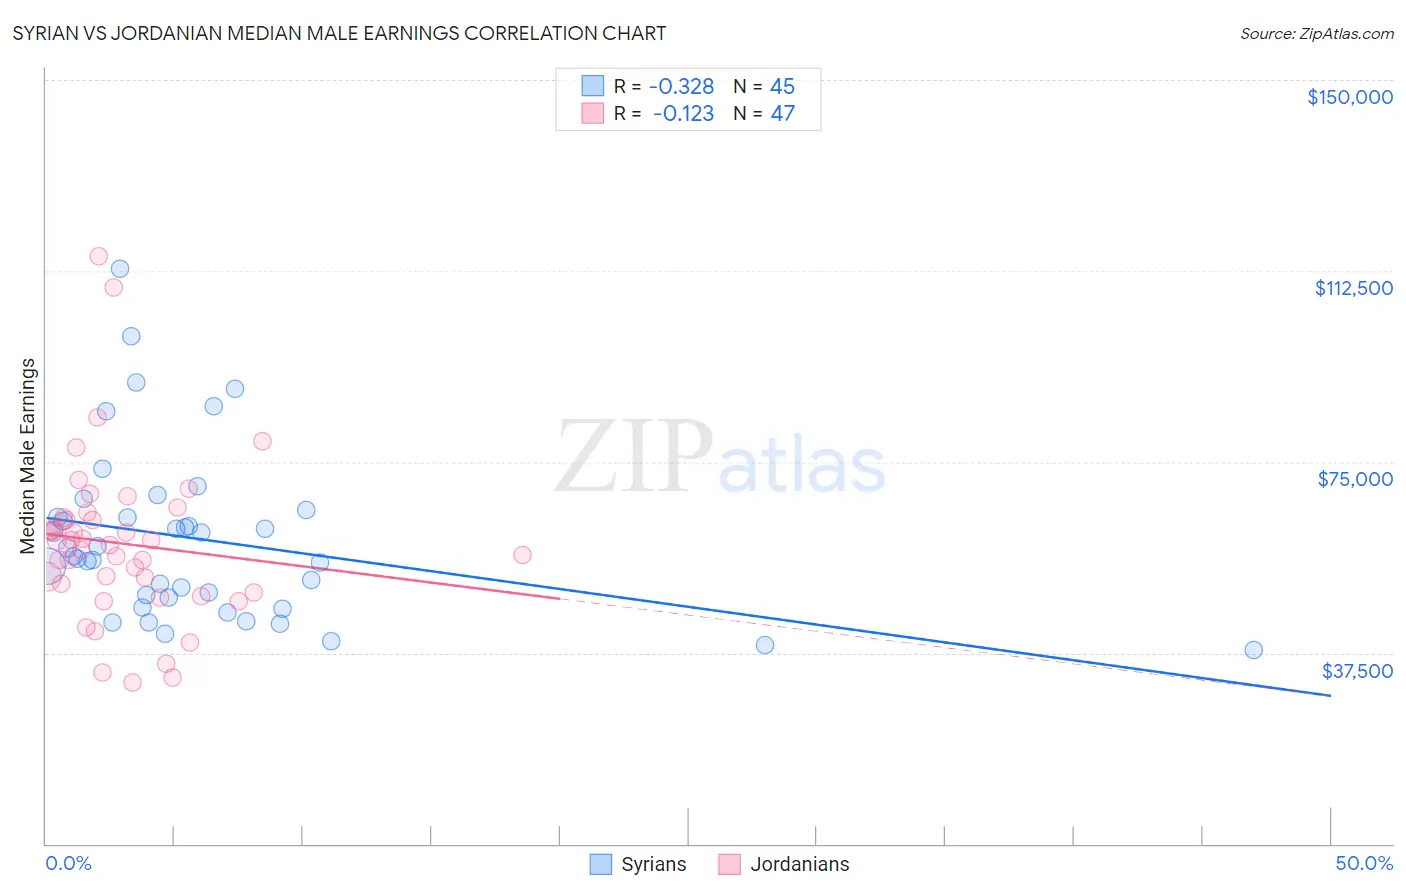
Syrian vs Jordanian Median Male Earnings Correlation Chart
The statistical analysis conducted on geographies consisting of 266,273,099 people shows a mild negative correlation between the proportion of Syrians and median male earnings in the United States with a correlation coefficient (R) of -0.328 and weighted average of $58,187. Similarly, the statistical analysis conducted on geographies consisting of 166,398,060 people shows a poor negative correlation between the proportion of Jordanians and median male earnings in the United States with a correlation coefficient (R) of -0.123 and weighted average of $58,500, a difference of 0.54%.
Median Male Earnings Correlation Summary
| Measurement | Syrian | Jordanian |
| Minimum | $38,125 | $31,660 |
| Maximum | $112,858 | $115,416 |
| Range | $74,733 | $83,756 |
| Mean | $59,779 | $58,929 |
| Median | $56,452 | $58,675 |
| Interquartile 25% (IQ1) | $47,297 | $49,250 |
| Interquartile 75% (IQ3) | $64,910 | $63,996 |
| Interquartile Range (IQR) | $17,614 | $14,746 |
| Standard Deviation (Sample) | $16,573 | $16,248 |
| Standard Deviation (Population) | $16,388 | $16,074 |
Demographics Similar to Syrians and Jordanians by Median Male Earnings
In terms of median male earnings, the demographic groups most similar to Syrians are Polish ($58,139, a difference of 0.080%), Armenian ($58,134, a difference of 0.090%), Immigrants from Western Asia ($58,131, a difference of 0.10%), Immigrants from Brazil ($58,324, a difference of 0.24%), and Immigrants from Northern Africa ($58,008, a difference of 0.31%). Similarly, the demographic groups most similar to Jordanians are Immigrants from Poland ($58,452, a difference of 0.080%), Assyrian/Chaldean/Syriac ($58,437, a difference of 0.11%), Northern European ($58,588, a difference of 0.15%), Immigrants from Brazil ($58,324, a difference of 0.30%), and Albanian ($58,680, a difference of 0.31%).
| Demographics | Rating | Rank | Median Male Earnings |
| Austrians | 99.2 /100 | #90 | Exceptional $59,359 |
| Laotians | 99.2 /100 | #91 | Exceptional $59,351 |
| Immigrants | Kazakhstan | 99.1 /100 | #92 | Exceptional $59,278 |
| Immigrants | Southern Europe | 99.0 /100 | #93 | Exceptional $59,217 |
| Immigrants | North Macedonia | 99.0 /100 | #94 | Exceptional $59,189 |
| Immigrants | Lebanon | 98.6 /100 | #95 | Exceptional $58,835 |
| Albanians | 98.4 /100 | #96 | Exceptional $58,680 |
| Northern Europeans | 98.2 /100 | #97 | Exceptional $58,588 |
| Jordanians | 98.1 /100 | #98 | Exceptional $58,500 |
| Immigrants | Poland | 98.0 /100 | #99 | Exceptional $58,452 |
| Assyrians/Chaldeans/Syriacs | 97.9 /100 | #100 | Exceptional $58,437 |
| Immigrants | Brazil | 97.7 /100 | #101 | Exceptional $58,324 |
| Syrians | 97.4 /100 | #102 | Exceptional $58,187 |
| Poles | 97.3 /100 | #103 | Exceptional $58,139 |
| Armenians | 97.3 /100 | #104 | Exceptional $58,134 |
| Immigrants | Western Asia | 97.3 /100 | #105 | Exceptional $58,131 |
| Immigrants | Northern Africa | 96.9 /100 | #106 | Exceptional $58,008 |
| Serbians | 96.8 /100 | #107 | Exceptional $57,975 |
| Immigrants | Uzbekistan | 96.7 /100 | #108 | Exceptional $57,941 |
| British | 96.5 /100 | #109 | Exceptional $57,890 |
| Palestinians | 96.2 /100 | #110 | Exceptional $57,778 |