Syrian vs Immigrants from India Householder Income Over 65 years

COMPARE

Syrian
Race
Ancestry
AfghanAfricanAlaska NativeAlaskan AthabascanAlbanianAleutAlsatianAmericanApacheArabArapahoArgentineanArmenianAssyrian/Chaldean/SyriacAustralianAustrianBahamianBangladeshiBarbadianBasqueBelgianBelizeanBermudanBhutaneseBlackfeetBolivianBrazilianBritishBritish West IndianBulgarianBurmeseCajunCambodianCanadianCape VerdeanCarpatho RusynCelticCentral AmericanCentral American IndianCherokeeCheyenneChickasawChileanChineseChippewaChoctawColombianColvilleComancheCosta RicanCreeCreekCroatianCrowCubanCypriotCzechCzechoslovakianDanishDelawareDominicanDutchDutch West IndianEastern EuropeanEcuadorianEgyptianEnglishEstonianEthiopianEuropeanFijianFilipinoFinnishFrenchFrench American IndianFrench CanadianGermanGerman RussianGhanaianGreekGuamanian/ChamorroGuatemalanGuyaneseHaitianHmongHonduranHopiHoumaHungarianIcelanderIndian (Asian)IndonesianInupiatIranianIraqiIrishIroquoisIsraeliItalianJamaicanJapaneseJordanianKenyanKiowaKoreanLaotianLatvianLebaneseLiberianLithuanianLumbeeLuxembourgerMacedonianMalaysianMalteseMarshalleseMenomineeMexicanMexican American IndianMongolianMoroccanNative HawaiianNavajoNepaleseNew ZealanderNicaraguanNigerianNorthern EuropeanNorwegianOkinawanOsageOttawaPaiutePakistaniPalestinianPanamanianParaguayanPennsylvania GermanPeruvianPimaPolishPortuguesePotawatomiPuebloPuerto RicanPuget Sound SalishRomanianRussianSalvadoranSamoanScandinavianScotch-IrishScottishSeminoleSenegaleseSerbianShoshoneSierra LeoneanSiouxSlavicSlovakSloveneSomaliSouth AfricanSouth AmericanSouth American IndianSoviet UnionSpaniardSpanishSpanish AmericanSpanish American IndianSri LankanSubsaharan AfricanSudaneseSwedishSwissSyrianTaiwaneseThaiTlingit-HaidaTohono O'OdhamTonganTrinidadian and TobagonianTsimshianTurkishU.S. Virgin IslanderUgandanUkrainianUruguayanUteVenezuelanVietnameseWelshWest IndianYakamaYaquiYugoslavianYumanYup'ikZimbabwean
Immigration
NonimmigrantsImmigrantsAfghanistanAfricaAlbaniaArgentinaArmeniaAsiaAustraliaAustriaBahamasBangladeshBarbadosBelarusBelgiumBelizeBoliviaBosnia and HerzegovinaBrazilBulgariaBurma/MyanmarCabo VerdeCambodiaCameroonCanadaCaribbeanCentral AmericaChileChinaColombiaCongoCosta RicaCroatiaCubaCzechoslovakiaDenmarkDominicaDominican RepublicEastern AfricaEastern AsiaEastern EuropeEcuadorEgyptEl SalvadorEnglandEritreaEthiopiaEuropeFijiFranceGermanyGhanaGreeceGrenadaGuatemalaGuyanaHaitiHondurasHong KongHungaryIndonesiaIranIraqIrelandIsraelItalyJamaicaJapanJordanKazakhstanKenyaKoreaKuwaitLaosLatin AmericaLatviaLebanonLiberiaLithuaniaMalaysiaMexicoMicronesiaMiddle AfricaMoldovaMoroccoNepalNetherlandsNicaraguaNigeriaNorth AmericaNorth MacedoniaNorthern AfricaNorthern EuropeNorwayOceaniaPakistanPanamaPeruPhilippinesPolandPortugalRomaniaRussiaSaudi ArabiaScotlandSenegalSerbiaSierra LeoneSingaporeSomaliaSouth AfricaSouth AmericaSouth Central AsiaSouth Eastern AsiaSouthern EuropeSpainSri LankaSt. Vincent and the GrenadinesSudanSwedenSwitzerlandSyriaTaiwanThailandTrinidad and TobagoTurkeyUgandaUkraineUruguayUzbekistanVenezuelaVietnamWest IndiesWestern AfricaWestern AsiaWestern EuropeYemenZaireZimbabweAzores
Immigrants from India
Race
Ancestry
AfghanAfricanAlaska NativeAlaskan AthabascanAlbanianAleutAlsatianAmericanApacheArabArapahoArgentineanArmenianAssyrian/Chaldean/SyriacAustralianAustrianBahamianBangladeshiBarbadianBasqueBelgianBelizeanBermudanBhutaneseBlackfeetBolivianBrazilianBritishBritish West IndianBulgarianBurmeseCajunCambodianCanadianCape VerdeanCarpatho RusynCelticCentral AmericanCentral American IndianCherokeeCheyenneChickasawChileanChineseChippewaChoctawColombianColvilleComancheCosta RicanCreeCreekCroatianCrowCubanCypriotCzechCzechoslovakianDanishDelawareDominicanDutchDutch West IndianEastern EuropeanEcuadorianEgyptianEnglishEstonianEthiopianEuropeanFijianFilipinoFinnishFrenchFrench American IndianFrench CanadianGermanGerman RussianGhanaianGreekGuamanian/ChamorroGuatemalanGuyaneseHaitianHmongHonduranHopiHoumaHungarianIcelanderIndian (Asian)IndonesianInupiatIranianIraqiIrishIroquoisIsraeliItalianJamaicanJapaneseJordanianKenyanKiowaKoreanLaotianLatvianLebaneseLiberianLithuanianLumbeeLuxembourgerMacedonianMalaysianMalteseMarshalleseMenomineeMexicanMexican American IndianMongolianMoroccanNative HawaiianNavajoNepaleseNew ZealanderNicaraguanNigerianNorthern EuropeanNorwegianOkinawanOsageOttawaPaiutePakistaniPalestinianPanamanianParaguayanPennsylvania GermanPeruvianPimaPolishPortuguesePotawatomiPuebloPuerto RicanPuget Sound SalishRomanianRussianSalvadoranSamoanScandinavianScotch-IrishScottishSeminoleSenegaleseSerbianShoshoneSierra LeoneanSiouxSlavicSlovakSloveneSomaliSouth AfricanSouth AmericanSouth American IndianSoviet UnionSpaniardSpanishSpanish AmericanSpanish American IndianSri LankanSubsaharan AfricanSudaneseSwedishSwissTaiwaneseThaiTlingit-HaidaTohono O'OdhamTonganTrinidadian and TobagonianTsimshianTurkishU.S. Virgin IslanderUgandanUkrainianUruguayanUteVenezuelanVietnameseWelshWest IndianYakamaYaquiYugoslavianYumanYup'ikZimbabwean
Immigration
NonimmigrantsImmigrantsAfghanistanAfricaAlbaniaArgentinaArmeniaAsiaAustraliaAustriaBahamasBangladeshBarbadosBelarusBelgiumBelizeBoliviaBosnia and HerzegovinaBrazilBulgariaBurma/MyanmarCabo VerdeCambodiaCameroonCanadaCaribbeanCentral AmericaChileChinaColombiaCongoCosta RicaCroatiaCubaCzechoslovakiaDenmarkDominicaDominican RepublicEastern AfricaEastern AsiaEastern EuropeEcuadorEgyptEl SalvadorEnglandEritreaEthiopiaEuropeFijiFranceGermanyGhanaGreeceGrenadaGuatemalaGuyanaHaitiHondurasHong KongHungaryIndiaIndonesiaIranIraqIrelandIsraelItalyJamaicaJapanJordanKazakhstanKenyaKoreaKuwaitLaosLatin AmericaLatviaLebanonLiberiaLithuaniaMalaysiaMexicoMicronesiaMiddle AfricaMoldovaMoroccoNepalNetherlandsNicaraguaNigeriaNorth AmericaNorth MacedoniaNorthern AfricaNorthern EuropeNorwayOceaniaPakistanPanamaPeruPhilippinesPolandPortugalRomaniaRussiaSaudi ArabiaScotlandSenegalSerbiaSierra LeoneSingaporeSomaliaSouth AfricaSouth AmericaSouth Central AsiaSouth Eastern AsiaSouthern EuropeSpainSri LankaSt. Vincent and the GrenadinesSudanSwedenSwitzerlandSyriaTaiwanThailandTrinidad and TobagoTurkeyUgandaUkraineUruguayUzbekistanVenezuelaVietnamWest IndiesWestern AfricaWestern AsiaWestern EuropeYemenZaireZimbabweAzores
Householder Income Over 65 years
Income
Poverty
Unemployment
Labor Participation
Family Structure
Vehicle Availability
Education Level
Disability

Householder Income Over 65 years Comparison

Syrians

Immigrants from India

Exceptional
Exceptional
$63,494
HOUSEHOLDER INCOME OVER 65 YEARS
93.4/ 100
METRIC RATING
112th/ 347
METRIC RANK
$72,804
HOUSEHOLDER INCOME OVER 65 YEARS
100.0/ 100
METRIC RATING
9th/ 347
METRIC RANK

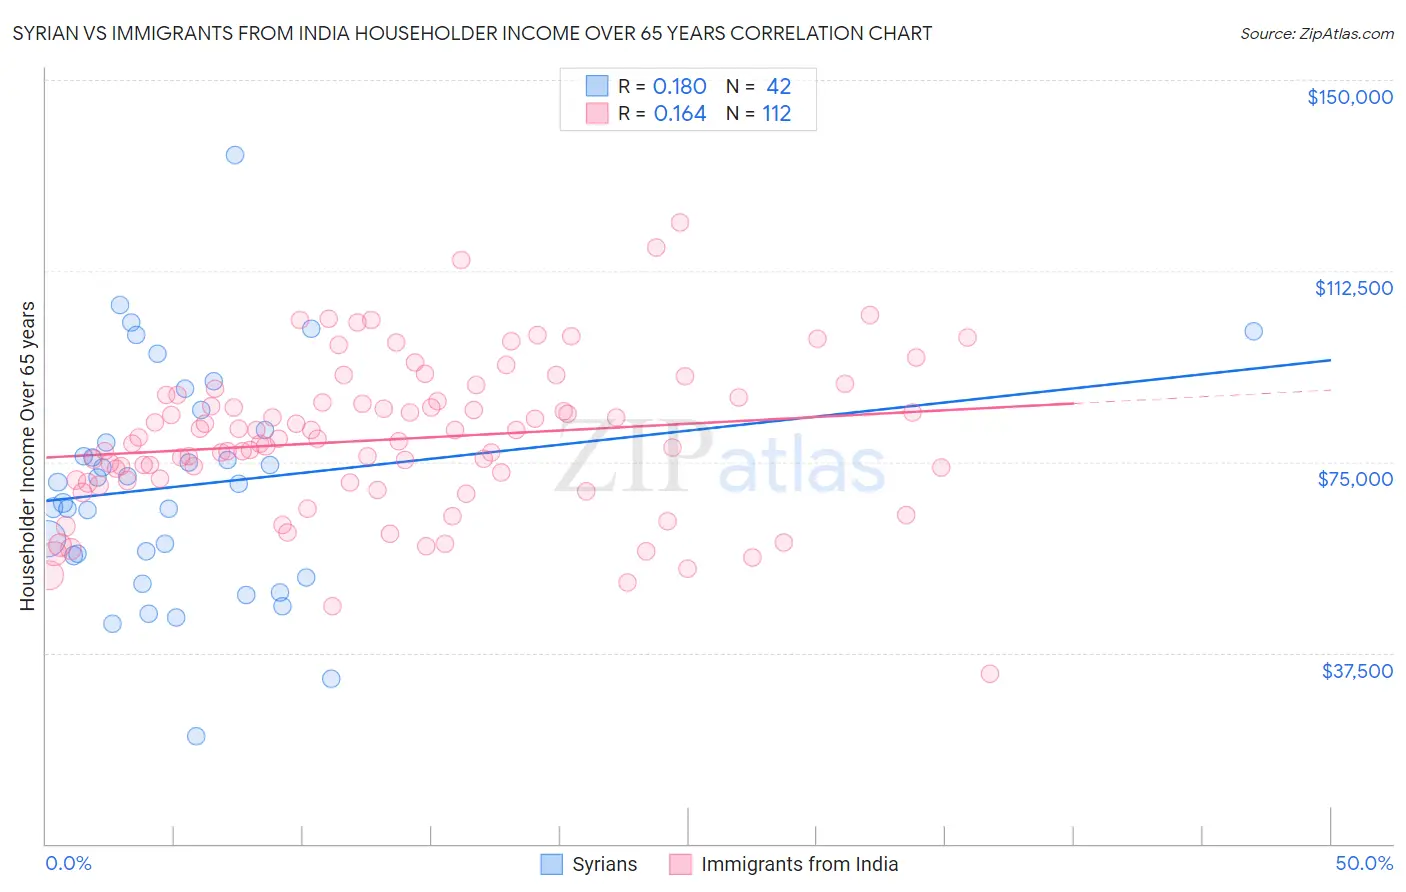
Syrian vs Immigrants from India Householder Income Over 65 years Correlation Chart

The statistical analysis conducted on geographies consisting of 265,818,751 people shows a poor positive correlation between the proportion of Syrians and household income with householder over the age of 65 in the United States with a correlation coefficient (R) of 0.180 and weighted average of $63,494. Similarly, the statistical analysis conducted on geographies consisting of 432,463,371 people shows a poor positive correlation between the proportion of Immigrants from India and household income with householder over the age of 65 in the United States with a correlation coefficient (R) of 0.164 and weighted average of $72,804, a difference of 14.7%.
Syrian vs Immigrants from India Householder Income Over 65 years

Householder Income Over 65 years Correlation Summary

MeasurementSyrianImmigrants from India
Minimum$21,115$33,500
Maximum$135,278$122,031
Range$114,162$88,531
Mean$70,420$79,433
Median$70,855$79,314
Interquartile 25% (IQ1)$56,590$71,130
Interquartile 75% (IQ3)$81,250$87,272
Interquartile Range (IQR)$24,660$16,142
Standard Deviation (Sample)$22,192$14,945
Standard Deviation (Population)$21,926$14,878

Similar Demographics by Householder Income Over 65 years

Demographics Similar to Syrians by Householder Income Over 65 years

In terms of householder income over 65 years, the demographic groups most similar to Syrians are Immigrants from Spain ($63,540, a difference of 0.070%), Immigrants from Serbia ($63,387, a difference of 0.17%), Immigrants from Saudi Arabia ($63,355, a difference of 0.22%), Immigrants from Zimbabwe ($63,643, a difference of 0.24%), and Croatian ($63,225, a difference of 0.43%).
DemographicsRating | RankHouseholder Income Over 65 years
Italians
95.5
/100
|
#105
Exceptional
$63,885
Immigrants | Argentina
95.5
/100
|
#106
Exceptional
$63,885
Pakistanis
95.3
/100
|
#107
Exceptional
$63,844
Palestinians
95.1
/100
|
#108
Exceptional
$63,800
Europeans
95.0
/100
|
#109
Exceptional
$63,779
Immigrants | Zimbabwe
94.3
/100
|
#110
Exceptional
$63,643
Immigrants | Spain
93.7
/100
|
#111
Exceptional
$63,540
Syrians
93.4
/100
|
#112
Exceptional
$63,494
Immigrants | Serbia
92.7
/100
|
#113
Exceptional
$63,387
Immigrants | Saudi Arabia
92.4
/100
|
#114
Exceptional
$63,355
Croatians
91.4
/100
|
#115
Exceptional
$63,225
Guamanians/Chamorros
91.1
/100
|
#116
Exceptional
$63,187
Immigrants | Croatia
90.9
/100
|
#117
Exceptional
$63,168
Danes
90.5
/100
|
#118
Exceptional
$63,117
Immigrants | Jordan
89.8
/100
|
#119
Excellent
$63,041

Demographics Similar to Immigrants from India by Householder Income Over 65 years

In terms of householder income over 65 years, the demographic groups most similar to Immigrants from India are Immigrants from Singapore ($72,963, a difference of 0.22%), Bhutanese ($72,288, a difference of 0.71%), Immigrants from Bolivia ($73,434, a difference of 0.87%), Thai ($72,099, a difference of 0.98%), and Cypriot ($71,714, a difference of 1.5%).
DemographicsRating | RankHouseholder Income Over 65 years
Iranians
100.0
/100
|
#2
Exceptional
$77,429
Immigrants | Taiwan
100.0
/100
|
#3
Exceptional
$77,051
Filipinos
100.0
/100
|
#4
Exceptional
$76,686
Immigrants | Iran
100.0
/100
|
#5
Exceptional
$75,081
Bolivians
100.0
/100
|
#6
Exceptional
$74,245
Immigrants | Bolivia
100.0
/100
|
#7
Exceptional
$73,434
Immigrants | Singapore
100.0
/100
|
#8
Exceptional
$72,963
Immigrants | India
100.0
/100
|
#9
Exceptional
$72,804
Bhutanese
100.0
/100
|
#10
Exceptional
$72,288
Thais
100.0
/100
|
#11
Exceptional
$72,099
Cypriots
100.0
/100
|
#12
Exceptional
$71,714
Immigrants | Hong Kong
100.0
/100
|
#13
Exceptional
$71,567
Burmese
100.0
/100
|
#14
Exceptional
$71,139
Native Hawaiians
100.0
/100
|
#15
Exceptional
$71,021
Okinawans
100.0
/100
|
#16
Exceptional
$70,846