Syrian vs Swedish Median Male Earnings
COMPARE
Syrian
Swedish
Median Male Earnings
Median Male Earnings Comparison
Syrians
Swedes
$58,187
MEDIAN MALE EARNINGS
97.4/ 100
METRIC RATING
102nd/ 347
METRIC RANK
$57,445
MEDIAN MALE EARNINGS
94.8/ 100
METRIC RATING
115th/ 347
METRIC RANK
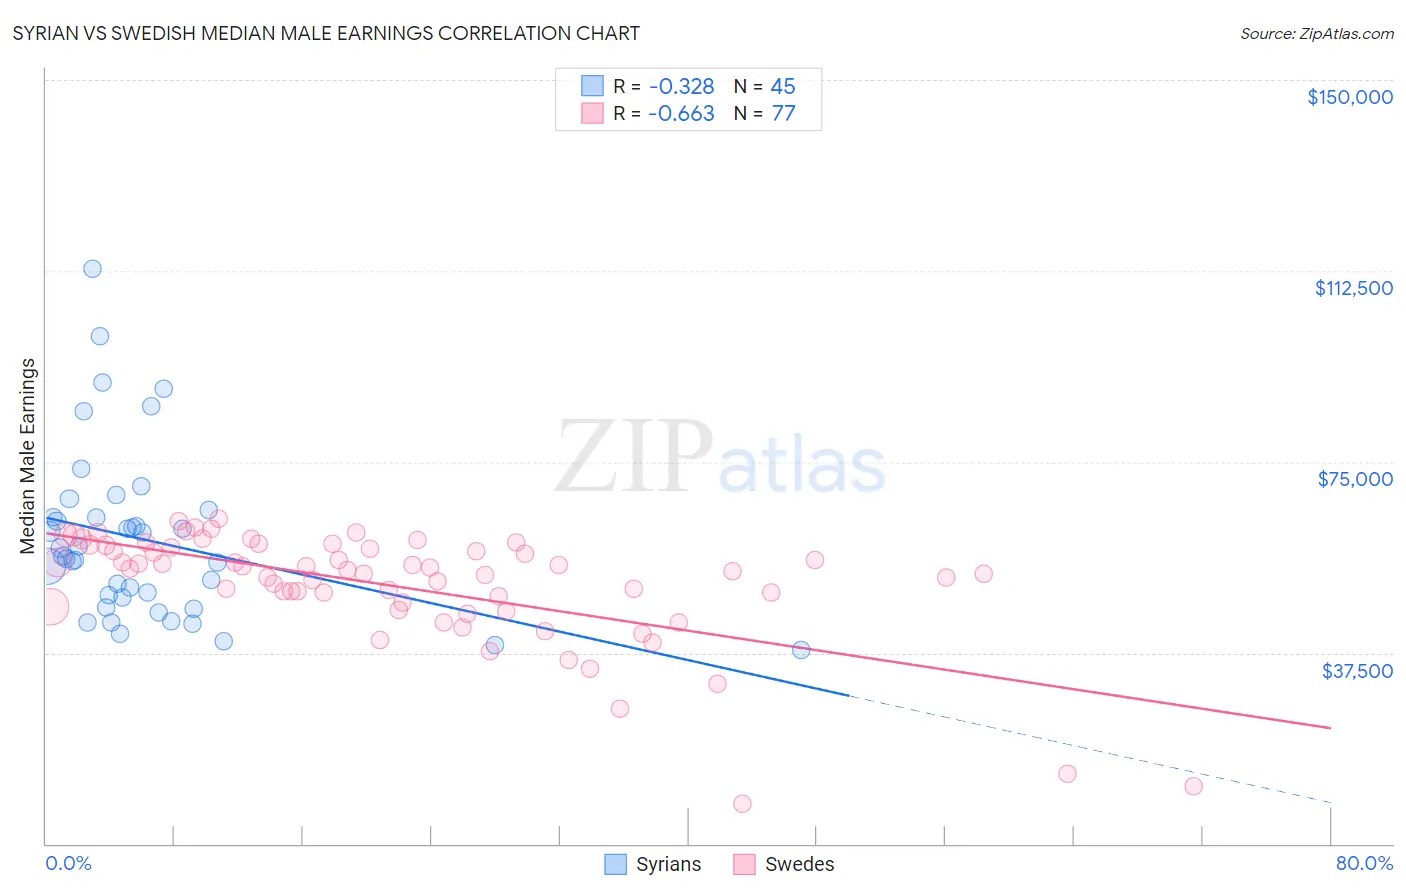
Syrian vs Swedish Median Male Earnings Correlation Chart
The statistical analysis conducted on geographies consisting of 266,273,099 people shows a mild negative correlation between the proportion of Syrians and median male earnings in the United States with a correlation coefficient (R) of -0.328 and weighted average of $58,187. Similarly, the statistical analysis conducted on geographies consisting of 538,411,583 people shows a significant negative correlation between the proportion of Swedes and median male earnings in the United States with a correlation coefficient (R) of -0.663 and weighted average of $57,445, a difference of 1.3%.
Median Male Earnings Correlation Summary
| Measurement | Syrian | Swedish |
| Minimum | $38,125 | $7,750 |
| Maximum | $112,858 | $63,730 |
| Range | $74,733 | $55,980 |
| Mean | $59,779 | $50,664 |
| Median | $56,452 | $53,721 |
| Interquartile 25% (IQ1) | $47,297 | $46,926 |
| Interquartile 75% (IQ3) | $64,910 | $58,399 |
| Interquartile Range (IQR) | $17,614 | $11,473 |
| Standard Deviation (Sample) | $16,573 | $11,170 |
| Standard Deviation (Population) | $16,388 | $11,097 |
Demographics Similar to Syrians and Swedes by Median Male Earnings
In terms of median male earnings, the demographic groups most similar to Syrians are Polish ($58,139, a difference of 0.080%), Armenian ($58,134, a difference of 0.090%), Immigrants from Western Asia ($58,131, a difference of 0.10%), Immigrants from Brazil ($58,324, a difference of 0.24%), and Immigrants from Northern Africa ($58,008, a difference of 0.31%). Similarly, the demographic groups most similar to Swedes are Lebanese ($57,409, a difference of 0.060%), Immigrants from Zimbabwe ($57,352, a difference of 0.16%), Immigrants from Kuwait ($57,562, a difference of 0.20%), Carpatho Rusyn ($57,572, a difference of 0.22%), and Immigrants from Afghanistan ($57,582, a difference of 0.24%).
| Demographics | Rating | Rank | Median Male Earnings |
| Jordanians | 98.1 /100 | #98 | Exceptional $58,500 |
| Immigrants | Poland | 98.0 /100 | #99 | Exceptional $58,452 |
| Assyrians/Chaldeans/Syriacs | 97.9 /100 | #100 | Exceptional $58,437 |
| Immigrants | Brazil | 97.7 /100 | #101 | Exceptional $58,324 |
| Syrians | 97.4 /100 | #102 | Exceptional $58,187 |
| Poles | 97.3 /100 | #103 | Exceptional $58,139 |
| Armenians | 97.3 /100 | #104 | Exceptional $58,134 |
| Immigrants | Western Asia | 97.3 /100 | #105 | Exceptional $58,131 |
| Immigrants | Northern Africa | 96.9 /100 | #106 | Exceptional $58,008 |
| Serbians | 96.8 /100 | #107 | Exceptional $57,975 |
| Immigrants | Uzbekistan | 96.7 /100 | #108 | Exceptional $57,941 |
| British | 96.5 /100 | #109 | Exceptional $57,890 |
| Palestinians | 96.2 /100 | #110 | Exceptional $57,778 |
| Europeans | 95.6 /100 | #111 | Exceptional $57,637 |
| Immigrants | Afghanistan | 95.4 /100 | #112 | Exceptional $57,582 |
| Carpatho Rusyns | 95.3 /100 | #113 | Exceptional $57,572 |
| Immigrants | Kuwait | 95.3 /100 | #114 | Exceptional $57,562 |
| Swedes | 94.8 /100 | #115 | Exceptional $57,445 |
| Lebanese | 94.6 /100 | #116 | Exceptional $57,409 |
| Immigrants | Zimbabwe | 94.3 /100 | #117 | Exceptional $57,352 |
| Hungarians | 94.0 /100 | #118 | Exceptional $57,309 |