Burmese vs Immigrants from India Median Male Earnings
COMPARE
Burmese
Immigrants from India
Median Male Earnings
Median Male Earnings Comparison
Burmese
Immigrants from India
$65,236
MEDIAN MALE EARNINGS
100.0/ 100
METRIC RATING
22nd/ 347
METRIC RANK
$74,207
MEDIAN MALE EARNINGS
100.0/ 100
METRIC RATING
2nd/ 347
METRIC RANK
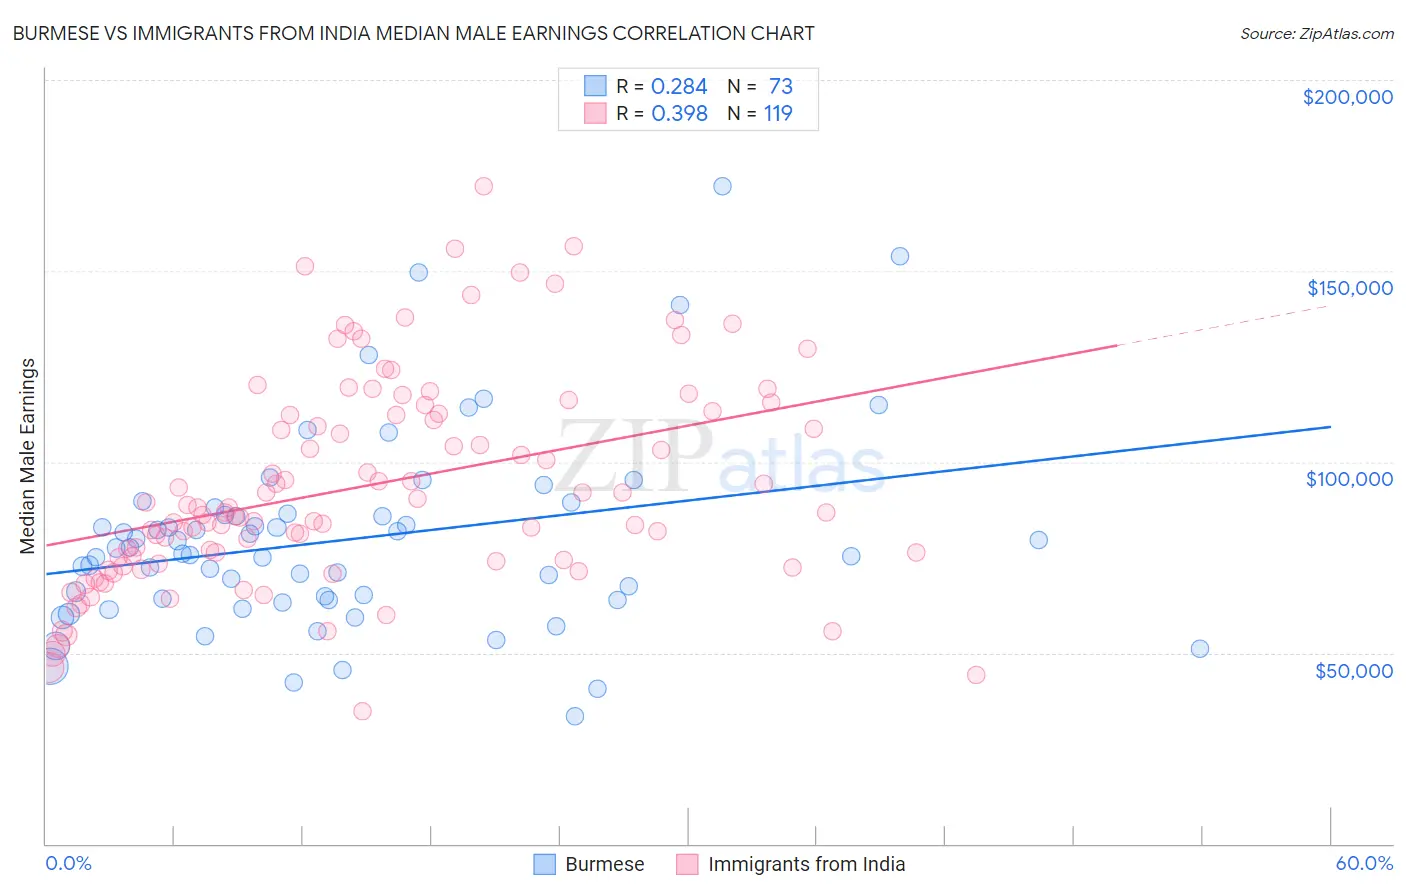
Burmese vs Immigrants from India Median Male Earnings Correlation Chart
The statistical analysis conducted on geographies consisting of 465,224,564 people shows a weak positive correlation between the proportion of Burmese and median male earnings in the United States with a correlation coefficient (R) of 0.284 and weighted average of $65,236. Similarly, the statistical analysis conducted on geographies consisting of 434,025,837 people shows a mild positive correlation between the proportion of Immigrants from India and median male earnings in the United States with a correlation coefficient (R) of 0.398 and weighted average of $74,207, a difference of 13.8%.
Median Male Earnings Correlation Summary
| Measurement | Burmese | Immigrants from India |
| Minimum | $33,399 | $34,783 |
| Maximum | $172,143 | $172,259 |
| Range | $138,744 | $137,476 |
| Mean | $79,644 | $93,517 |
| Median | $75,943 | $86,905 |
| Interquartile 25% (IQ1) | $63,717 | $74,008 |
| Interquartile 75% (IQ3) | $86,383 | $112,721 |
| Interquartile Range (IQR) | $22,666 | $38,713 |
| Standard Deviation (Sample) | $25,713 | $27,317 |
| Standard Deviation (Population) | $25,536 | $27,202 |
Demographics Similar to Burmese and Immigrants from India by Median Male Earnings
In terms of median male earnings, the demographic groups most similar to Burmese are Immigrants from Sweden ($65,406, a difference of 0.26%), Immigrants from Japan ($65,518, a difference of 0.43%), Cypriot ($65,549, a difference of 0.48%), Indian (Asian) ($66,078, a difference of 1.3%), and Immigrants from Belgium ($66,125, a difference of 1.4%). Similarly, the demographic groups most similar to Immigrants from India are Immigrants from Taiwan ($74,031, a difference of 0.24%), Thai ($72,135, a difference of 2.9%), Immigrants from Singapore ($71,348, a difference of 4.0%), Iranian ($70,648, a difference of 5.0%), and Immigrants from Hong Kong ($70,146, a difference of 5.8%).
| Demographics | Rating | Rank | Median Male Earnings |
| Immigrants | India | 100.0 /100 | #2 | Exceptional $74,207 |
| Immigrants | Taiwan | 100.0 /100 | #3 | Exceptional $74,031 |
| Thais | 100.0 /100 | #4 | Exceptional $72,135 |
| Immigrants | Singapore | 100.0 /100 | #5 | Exceptional $71,348 |
| Iranians | 100.0 /100 | #6 | Exceptional $70,648 |
| Immigrants | Hong Kong | 100.0 /100 | #7 | Exceptional $70,146 |
| Immigrants | Iran | 100.0 /100 | #8 | Exceptional $69,284 |
| Immigrants | South Central Asia | 100.0 /100 | #9 | Exceptional $68,960 |
| Immigrants | Israel | 100.0 /100 | #10 | Exceptional $68,716 |
| Immigrants | Ireland | 100.0 /100 | #11 | Exceptional $67,698 |
| Immigrants | Australia | 100.0 /100 | #12 | Exceptional $67,634 |
| Immigrants | China | 100.0 /100 | #13 | Exceptional $67,353 |
| Okinawans | 100.0 /100 | #14 | Exceptional $67,232 |
| Immigrants | Eastern Asia | 100.0 /100 | #15 | Exceptional $66,903 |
| Eastern Europeans | 100.0 /100 | #16 | Exceptional $66,472 |
| Immigrants | Belgium | 100.0 /100 | #17 | Exceptional $66,125 |
| Indians (Asian) | 100.0 /100 | #18 | Exceptional $66,078 |
| Cypriots | 100.0 /100 | #19 | Exceptional $65,549 |
| Immigrants | Japan | 100.0 /100 | #20 | Exceptional $65,518 |
| Immigrants | Sweden | 100.0 /100 | #21 | Exceptional $65,406 |
| Burmese | 100.0 /100 | #22 | Exceptional $65,236 |