Syrian vs Choctaw Median Male Earnings
COMPARE
Syrian
Choctaw
Median Male Earnings
Median Male Earnings Comparison
Syrians
Choctaw
$58,187
MEDIAN MALE EARNINGS
97.4/ 100
METRIC RATING
102nd/ 347
METRIC RANK
$47,729
MEDIAN MALE EARNINGS
0.1/ 100
METRIC RATING
291st/ 347
METRIC RANK
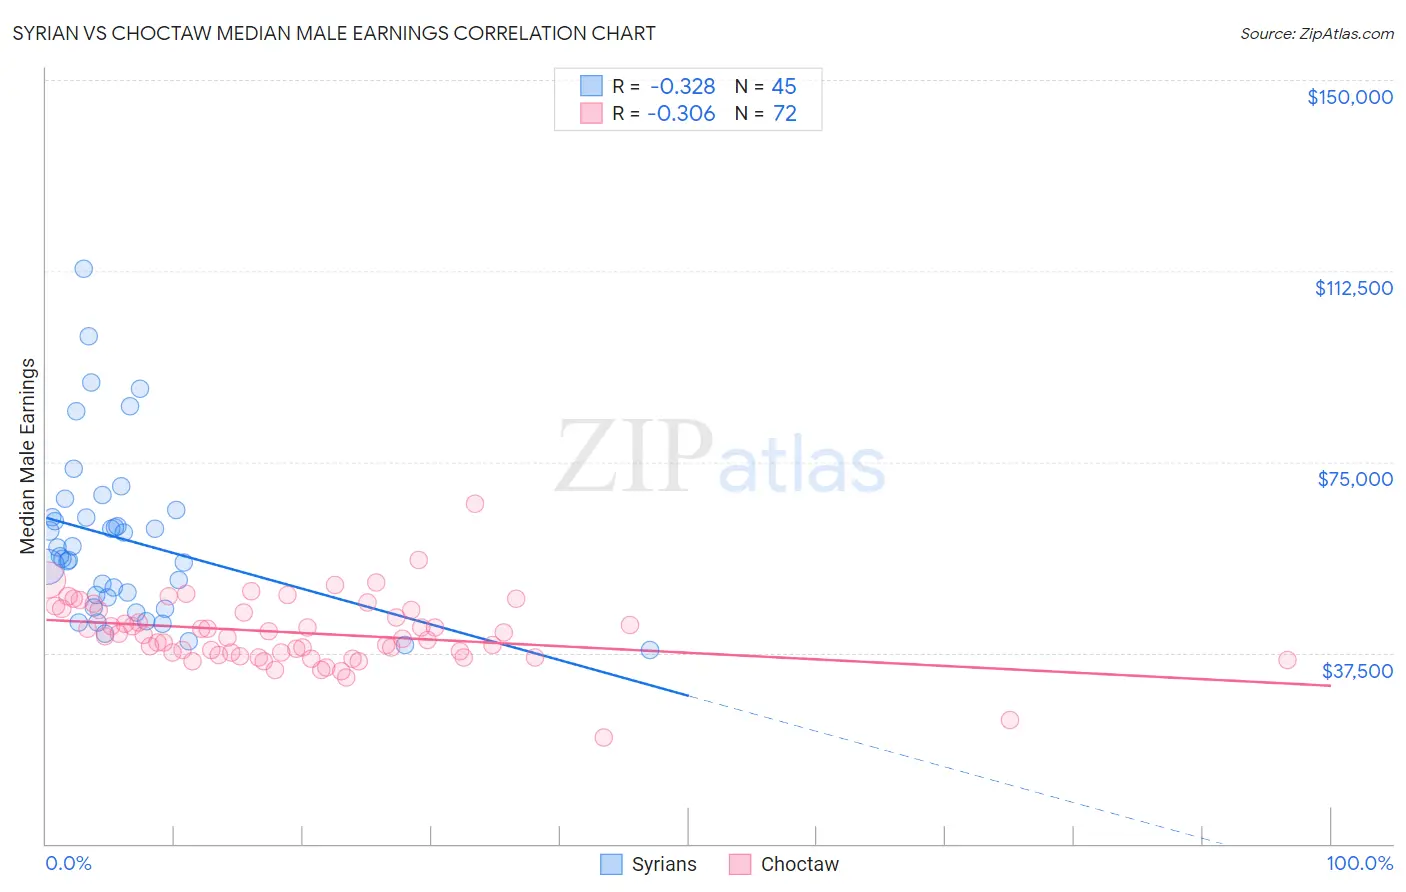
Syrian vs Choctaw Median Male Earnings Correlation Chart
The statistical analysis conducted on geographies consisting of 266,273,099 people shows a mild negative correlation between the proportion of Syrians and median male earnings in the United States with a correlation coefficient (R) of -0.328 and weighted average of $58,187. Similarly, the statistical analysis conducted on geographies consisting of 269,619,289 people shows a mild negative correlation between the proportion of Choctaw and median male earnings in the United States with a correlation coefficient (R) of -0.306 and weighted average of $47,729, a difference of 21.9%.
Median Male Earnings Correlation Summary
| Measurement | Syrian | Choctaw |
| Minimum | $38,125 | $20,833 |
| Maximum | $112,858 | $66,862 |
| Range | $74,733 | $46,029 |
| Mean | $59,779 | $41,431 |
| Median | $56,452 | $40,848 |
| Interquartile 25% (IQ1) | $47,297 | $37,230 |
| Interquartile 75% (IQ3) | $64,910 | $45,935 |
| Interquartile Range (IQR) | $17,614 | $8,705 |
| Standard Deviation (Sample) | $16,573 | $6,709 |
| Standard Deviation (Population) | $16,388 | $6,663 |
Similar Demographics by Median Male Earnings
Demographics Similar to Syrians by Median Male Earnings
In terms of median male earnings, the demographic groups most similar to Syrians are Polish ($58,139, a difference of 0.080%), Armenian ($58,134, a difference of 0.090%), Immigrants from Western Asia ($58,131, a difference of 0.10%), Immigrants from Brazil ($58,324, a difference of 0.24%), and Immigrants from Northern Africa ($58,008, a difference of 0.31%).
| Demographics | Rating | Rank | Median Male Earnings |
| Immigrants | Lebanon | 98.6 /100 | #95 | Exceptional $58,835 |
| Albanians | 98.4 /100 | #96 | Exceptional $58,680 |
| Northern Europeans | 98.2 /100 | #97 | Exceptional $58,588 |
| Jordanians | 98.1 /100 | #98 | Exceptional $58,500 |
| Immigrants | Poland | 98.0 /100 | #99 | Exceptional $58,452 |
| Assyrians/Chaldeans/Syriacs | 97.9 /100 | #100 | Exceptional $58,437 |
| Immigrants | Brazil | 97.7 /100 | #101 | Exceptional $58,324 |
| Syrians | 97.4 /100 | #102 | Exceptional $58,187 |
| Poles | 97.3 /100 | #103 | Exceptional $58,139 |
| Armenians | 97.3 /100 | #104 | Exceptional $58,134 |
| Immigrants | Western Asia | 97.3 /100 | #105 | Exceptional $58,131 |
| Immigrants | Northern Africa | 96.9 /100 | #106 | Exceptional $58,008 |
| Serbians | 96.8 /100 | #107 | Exceptional $57,975 |
| Immigrants | Uzbekistan | 96.7 /100 | #108 | Exceptional $57,941 |
| British | 96.5 /100 | #109 | Exceptional $57,890 |
Demographics Similar to Choctaw by Median Male Earnings
In terms of median male earnings, the demographic groups most similar to Choctaw are Immigrants from Dominica ($47,651, a difference of 0.16%), Immigrants from Belize ($47,809, a difference of 0.17%), Chickasaw ($47,832, a difference of 0.22%), Shoshone ($47,930, a difference of 0.42%), and Indonesian ($47,503, a difference of 0.48%).
| Demographics | Rating | Rank | Median Male Earnings |
| Africans | 0.2 /100 | #284 | Tragic $47,994 |
| Paiute | 0.2 /100 | #285 | Tragic $47,991 |
| Mexican American Indians | 0.2 /100 | #286 | Tragic $47,990 |
| Immigrants | El Salvador | 0.2 /100 | #287 | Tragic $47,973 |
| Shoshone | 0.2 /100 | #288 | Tragic $47,930 |
| Chickasaw | 0.1 /100 | #289 | Tragic $47,832 |
| Immigrants | Belize | 0.1 /100 | #290 | Tragic $47,809 |
| Choctaw | 0.1 /100 | #291 | Tragic $47,729 |
| Immigrants | Dominica | 0.1 /100 | #292 | Tragic $47,651 |
| Indonesians | 0.1 /100 | #293 | Tragic $47,503 |
| Immigrants | Nicaragua | 0.1 /100 | #294 | Tragic $47,482 |
| Central American Indians | 0.1 /100 | #295 | Tragic $47,433 |
| Inupiat | 0.1 /100 | #296 | Tragic $47,281 |
| Dominicans | 0.1 /100 | #297 | Tragic $47,204 |
| Immigrants | Micronesia | 0.1 /100 | #298 | Tragic $47,177 |