Afghan vs Immigrants from Croatia Median Household Income
COMPARE
Afghan
Immigrants from Croatia
Median Household Income
Median Household Income Comparison
Afghans
Immigrants from Croatia
$97,026
MEDIAN HOUSEHOLD INCOME
100.0/ 100
METRIC RATING
39th/ 347
METRIC RANK
$92,225
MEDIAN HOUSEHOLD INCOME
99.0/ 100
METRIC RATING
85th/ 347
METRIC RANK
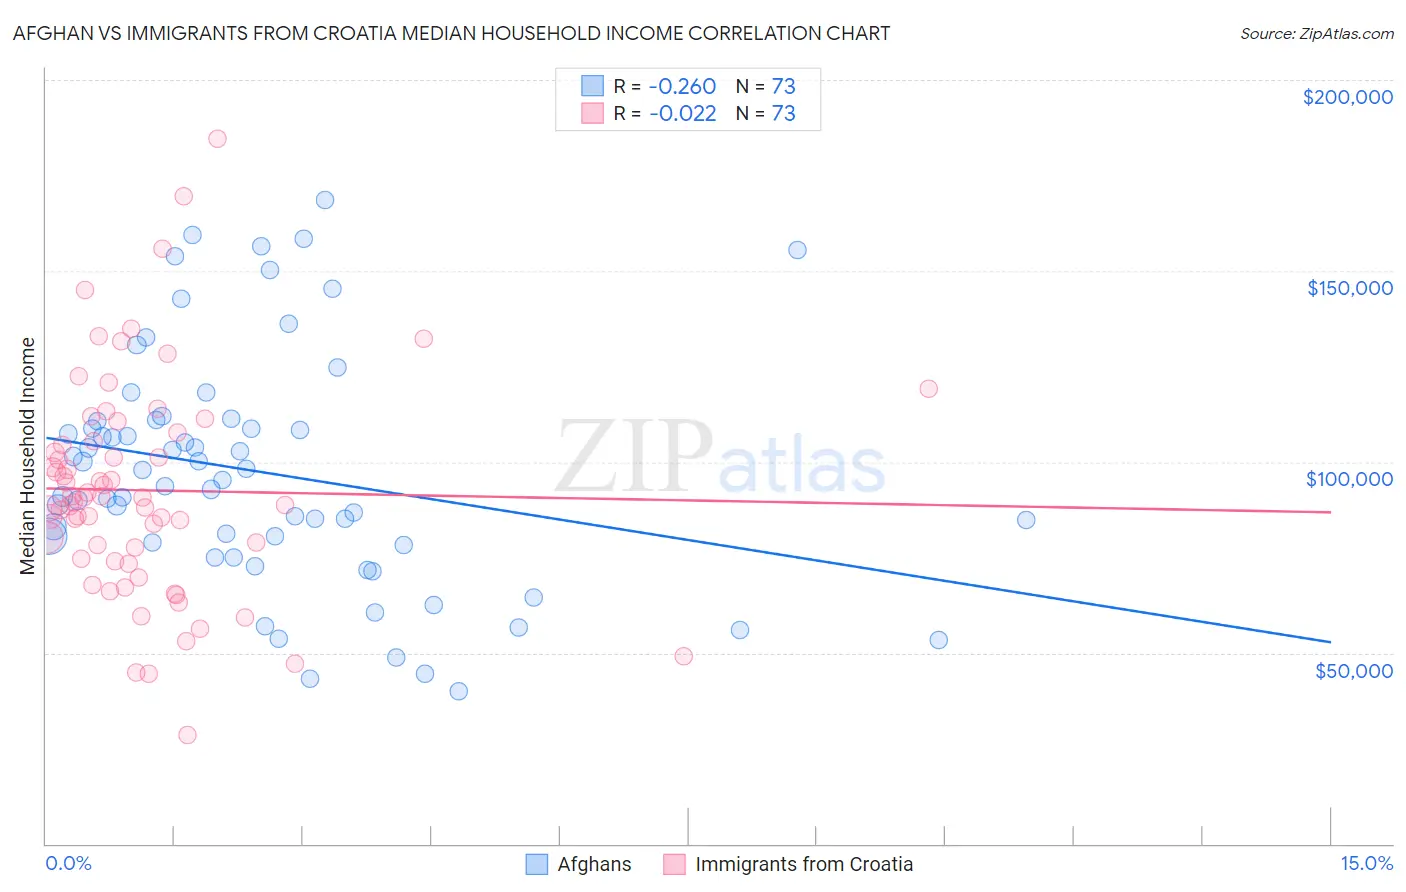
Afghan vs Immigrants from Croatia Median Household Income Correlation Chart
The statistical analysis conducted on geographies consisting of 148,820,759 people shows a weak negative correlation between the proportion of Afghans and median household income in the United States with a correlation coefficient (R) of -0.260 and weighted average of $97,026. Similarly, the statistical analysis conducted on geographies consisting of 132,561,989 people shows no correlation between the proportion of Immigrants from Croatia and median household income in the United States with a correlation coefficient (R) of -0.022 and weighted average of $92,225, a difference of 5.2%.
Median Household Income Correlation Summary
| Measurement | Afghan | Immigrants from Croatia |
| Minimum | $40,069 | $28,542 |
| Maximum | $168,646 | $184,569 |
| Range | $128,577 | $156,027 |
| Mean | $97,284 | $92,543 |
| Median | $95,399 | $90,687 |
| Interquartile 25% (IQ1) | $78,550 | $74,217 |
| Interquartile 75% (IQ3) | $110,861 | $106,459 |
| Interquartile Range (IQR) | $32,311 | $32,243 |
| Standard Deviation (Sample) | $30,429 | $28,654 |
| Standard Deviation (Population) | $30,220 | $28,457 |
Similar Demographics by Median Household Income
Demographics Similar to Afghans by Median Household Income
In terms of median household income, the demographic groups most similar to Afghans are Maltese ($97,015, a difference of 0.010%), Immigrants from Turkey ($96,964, a difference of 0.060%), Immigrants from Lithuania ($96,836, a difference of 0.20%), Immigrants from Indonesia ($97,297, a difference of 0.28%), and Latvian ($97,311, a difference of 0.29%).
| Demographics | Rating | Rank | Median Household Income |
| Immigrants | Denmark | 100.0 /100 | #32 | Exceptional $98,510 |
| Chinese | 100.0 /100 | #33 | Exceptional $98,496 |
| Russians | 100.0 /100 | #34 | Exceptional $98,008 |
| Immigrants | Switzerland | 100.0 /100 | #35 | Exceptional $97,979 |
| Immigrants | Pakistan | 100.0 /100 | #36 | Exceptional $97,528 |
| Latvians | 100.0 /100 | #37 | Exceptional $97,311 |
| Immigrants | Indonesia | 100.0 /100 | #38 | Exceptional $97,297 |
| Afghans | 100.0 /100 | #39 | Exceptional $97,026 |
| Maltese | 100.0 /100 | #40 | Exceptional $97,015 |
| Immigrants | Turkey | 100.0 /100 | #41 | Exceptional $96,964 |
| Immigrants | Lithuania | 99.9 /100 | #42 | Exceptional $96,836 |
| Immigrants | France | 99.9 /100 | #43 | Exceptional $96,743 |
| Immigrants | Greece | 99.9 /100 | #44 | Exceptional $96,675 |
| Israelis | 99.9 /100 | #45 | Exceptional $96,552 |
| Australians | 99.9 /100 | #46 | Exceptional $96,490 |
Demographics Similar to Immigrants from Croatia by Median Household Income
In terms of median household income, the demographic groups most similar to Immigrants from Croatia are Immigrants from England ($92,098, a difference of 0.14%), Immigrants from Hungary ($92,094, a difference of 0.14%), Immigrants from Argentina ($92,417, a difference of 0.21%), Immigrants from Canada ($92,029, a difference of 0.21%), and Romanian ($91,994, a difference of 0.25%).
| Demographics | Rating | Rank | Median Household Income |
| Immigrants | Bulgaria | 99.4 /100 | #78 | Exceptional $93,148 |
| Sri Lankans | 99.4 /100 | #79 | Exceptional $93,093 |
| Tongans | 99.4 /100 | #80 | Exceptional $93,076 |
| Immigrants | Eastern Europe | 99.4 /100 | #81 | Exceptional $93,051 |
| Immigrants | Spain | 99.3 /100 | #82 | Exceptional $92,732 |
| Italians | 99.1 /100 | #83 | Exceptional $92,475 |
| Immigrants | Argentina | 99.1 /100 | #84 | Exceptional $92,417 |
| Immigrants | Croatia | 99.0 /100 | #85 | Exceptional $92,225 |
| Immigrants | England | 98.9 /100 | #86 | Exceptional $92,098 |
| Immigrants | Hungary | 98.9 /100 | #87 | Exceptional $92,094 |
| Immigrants | Canada | 98.8 /100 | #88 | Exceptional $92,029 |
| Romanians | 98.8 /100 | #89 | Exceptional $91,994 |
| Assyrians/Chaldeans/Syriacs | 98.8 /100 | #90 | Exceptional $91,991 |
| Immigrants | Vietnam | 98.8 /100 | #91 | Exceptional $91,987 |
| Immigrants | Western Europe | 98.8 /100 | #92 | Exceptional $91,936 |